XAUUSD Daily Market Analysis—March 27, 2025 by Kohinoor Free VIP Signals
- Kohinoor Free VIP Trading Signals
- Mar 27, 2025
- 3 min read
💬 WhatsApp Kohinoor Free VIP Signals here for FREE Gold Forex Live Trade Setups & Market Analysis.
Current Market Overview
As of today, the live gold price stands at 3037 USD. This analysis will delve into the daily and 4-hour time frames using various technical indicators such as Fibonacci Retracement Levels, EMA, RSI divergence, Weekly and Daily Pivots, Smart Money Concepts (SMC), Support & Resistance Levels, Order Blocks, and MACD.
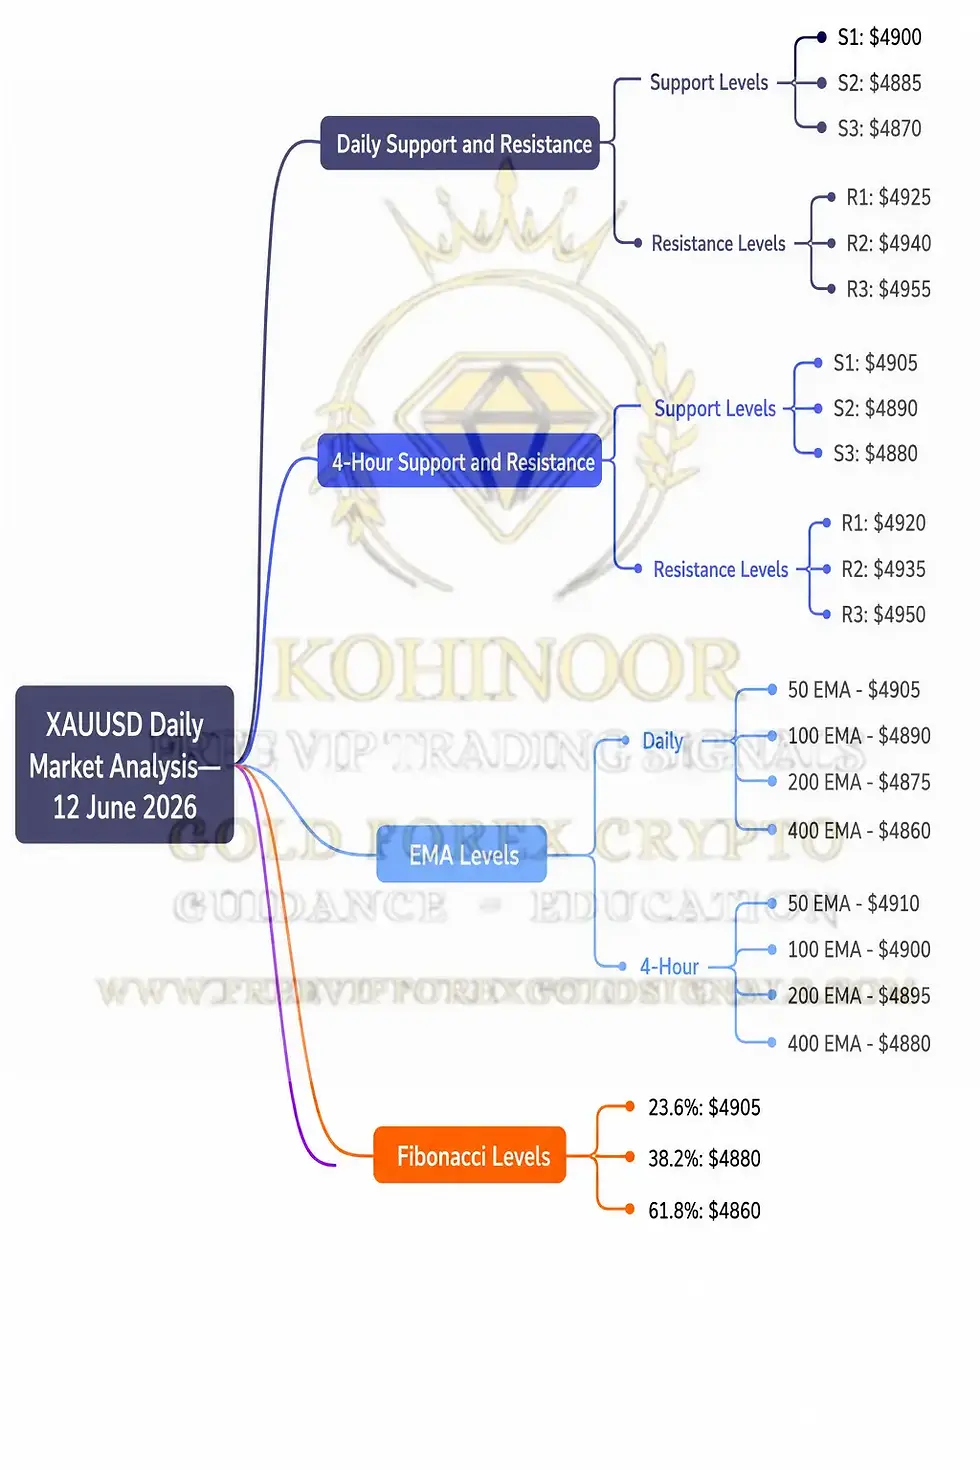
Support & Resistance Levels
In the context of the current market dynamics, support and resistance levels play a crucial role in identifying potential entry and exit points.
Daily Support Levels:
S1: 3000
S2: 2950
S3: 2900
Daily Resistance Levels:
R1: 3050
R2: 3100
R3: 3150
4-Hour Support Levels:
S1: 3020
S2: 3010
S3: 3000
4-Hour Resistance Levels:
R1: 3040
R2: 3060
R3: 3075
Fibonacci Retracement Levels
Using Fibonacci retracement levels, we can identify potential reversal zones. The key levels based on the recent swing highs and lows are:
Key Fibonacci Levels:
23.6%: 3025
38.2%: 3005
61.8%: 2985
These levels are critical for traders looking to capitalize on price reversals.
Exponential Moving Averages (EMA)
The EMA indicators help in understanding the trend direction:
Daily EMA Levels:
EMA 50: 3020
EMA 100: 3005
EMA 200: 2980
EMA 400: 2950
4-Hour EMA Levels:
EMA 50: 3030
EMA 100: 3025
EMA 200: 3010
EMA 400: 3000
RSI Divergence
The Relative Strength Index (RSI) indicates potential overbought or oversold conditions. Currently, the RSI is showing divergence, suggesting a possible reversal:
Current RSI Level: 72 (Overbought)
Order Blocks
Order blocks are areas where significant buying or selling has occurred. Observing these can provide insight into future price movements:
Bullish Order Block: 3015-3025
Bearish Order Block: 3055-3065
MACD Analysis
The MACD indicator provides insight into the momentum of the price:
Current MACD: Positive, indicating bullish momentum.
Signal Line: Crossed above the MACD line, suggesting a buy signal.
Fundamental Analysis and Upcoming USD News
It's essential to keep an eye on upcoming economic data releases that can affect the gold market:
Upcoming USD News:
Non-Farm Payrolls Release: Expected next week.
FOMC Meeting Minutes: Scheduled for this month.
These events could cause volatility in the gold market and should be monitored closely by traders.

XAUUSD Daily Analysis Summary by Kohinoor Free VIP Signals
💬 WhatsApp Kohinoor Free VIP Signals here for FREE Gold Forex Live Trade Setups & Market Analysis.
🥇 Join our FREE Telegram Channel: @Kohinoorfreevipgoldforexsignals
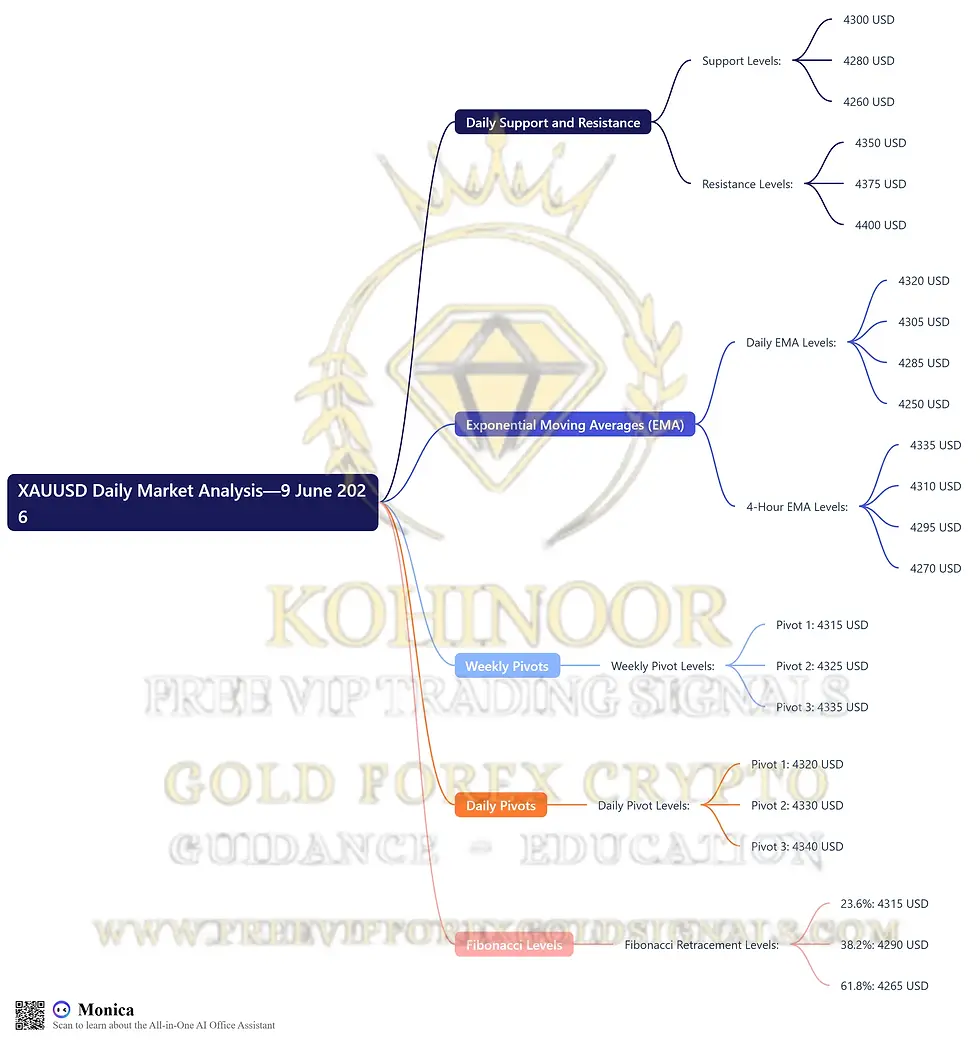
Key Levels Summary
Daily Support and Resistance:
Support: 3000, 2950, 2900
Resistance: 3050, 3100, 3150
EMA Levels (Daily):
50: 3020
100: 3005
200: 2980
400: 2950
EMA Levels (4-Hour):
50: 3030
100: 3025
200: 3010
400: 3000
Weekly Pivots:
Pivot Point: 3030
Resistance Levels: 3050, 3070
Support Levels: 3010, 2990
Daily Pivots:
Pivot Point: 3020
Resistance Levels: 3040
Support Levels: 3000
Fibonacci Levels:
23.6%: 3025
38.2%: 3005
61.8%: 2985
Risk Warning: Trading Forex and CFDs carries a high level of risk to your capital and you should only trade with money you can afford to lose. Trading Forex and CFDs may not be suitable for all investors, so please ensure that you fully understand the risks involved and seek independent advice if necessary. Please read and ensure you fully understand our Risk Disclosure. Not Financial Advice. Trade at your own risk. Take Partial Profits, Use Strict Stop Loss, and Proper Risk Management.
FAQs
Why is Kohinoor Free VIP Signals the best signal provider? Kohinoor Free VIP Signals offers not only FREE signals but also educational resources, daily market analysis, and ebooks.
Which brokers are trusted for Gold Forex Crypto trading? Based on client feedback, we recommend brokers like:
What are the benefits of joining Kohinoor Free VIP Signals? Members receive free trading signals, market analysis, and educational materials.
How do I manage my risk while trading gold? Use strict stop-loss orders, take partial profits, and ensure proper risk management.
What is the best time frame for trading gold? It depends on your trading strategy; both daily and 4-hour time frames can be effective.
Can I trade gold with a small capital? Yes, many brokers offer leverage, allowing you to trade gold with a smaller capital.
What is the significance of Fibonacci levels in trading? Fibonacci levels help identify potential reversal points in the market.
How often should I check the market for updates? Regular updates are essential, especially before major economic news releases.
Conclusion
In summary, today's analysis of Gold XAUUSD highlights crucial support and resistance levels, EMA trends, and upcoming economic events. For the best trading signals and insights, connect with Kohinoor Free VIP Signals today!

Comments