Gold XAUUSD Daily Market Analysis - 19 June 2026
- Kohinoor Free VIP Trading Signals
- 2 days ago
- 3 min read
Introduction
As we delve into today's market analysis for Gold (XAUUSD), currently priced at 4145 USD, we will explore various indicators including Fibonacci Retracement Levels, EMA, RSI divergence, Weekly and Daily Pivots, Smart Money Concepts (SMC), Support & Resistance Levels, Order Blocks, and MACD. This comprehensive analysis aims to provide traders from Dubai, Singapore, India, Australia, Germany, and the Netherlands with insights to navigate the Gold market effectively.
Market Overview
Gold has always been a safe haven asset, especially during times of economic uncertainty. With the current price of 4145 USD, it’s crucial to analyze the daily and 4-hour time frames to identify potential trading opportunities.
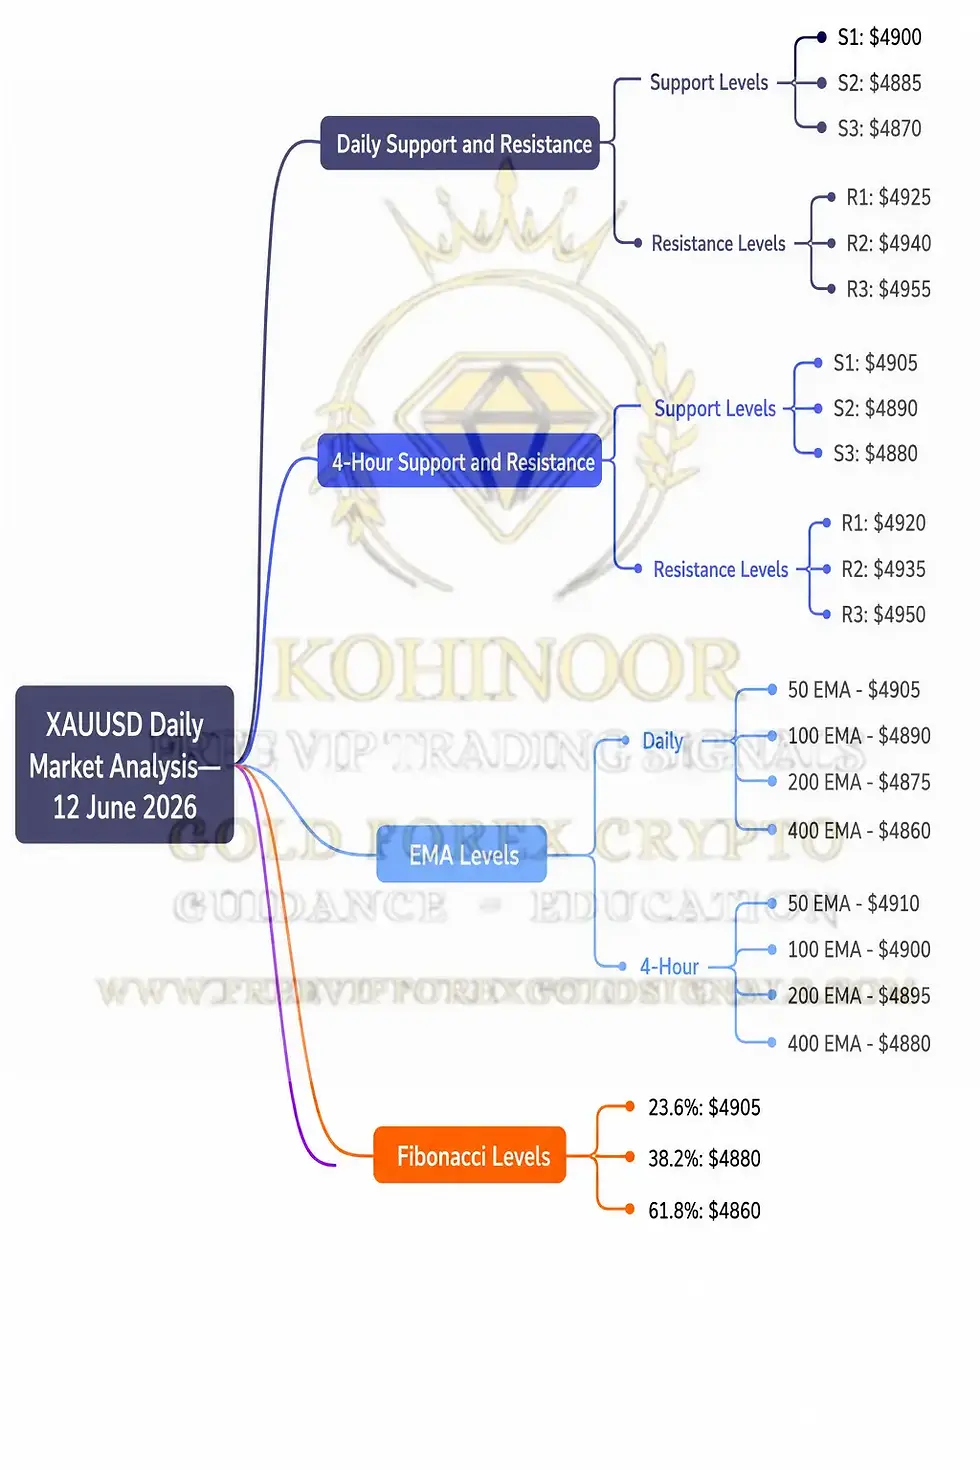
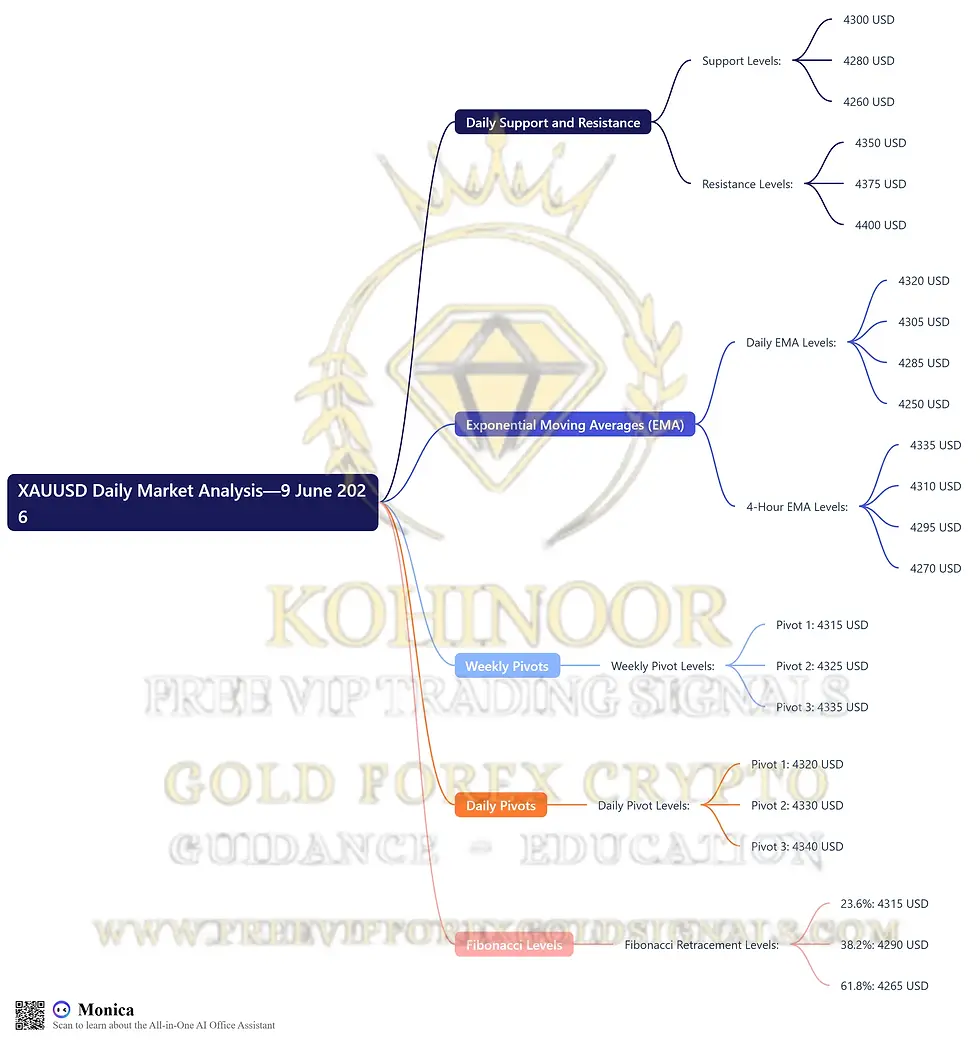
Support & Resistance Levels
In our analysis, we will identify significant support and resistance levels on both the daily and 4-hour time frames.
Daily Support Levels:
Level 1: 4100
Level 2: 4080
Level 3: 4050
Daily Resistance Levels:
Level 1: 4170
Level 2: 4200
Level 3: 4225
4-Hour Support Levels:
Level 1: 4120
Level 2: 4105
Level 3: 4090
4-Hour Resistance Levels:
Level 1: 4155
Level 2: 4165
Level 3: 4180
Fibonacci Retracement Levels
Utilizing Fibonacci Retracement Levels helps in identifying potential reversal points. The daily swing levels are as follows:
Fibonacci Levels:
23.6%: 4155
38.2%: 4130
61.8%: 4100
These levels can provide traders with insight into where price may retrace before continuing its trend.
Exponential Moving Averages (EMA)
The EMA provides valuable information about the trend direction. Based on the current market price, here are the EMA levels:
Daily EMA Levels:
EMA 50: 4125
EMA 100: 4100
EMA 200: 4080
EMA 400: 4050
4-Hour EMA Levels:
EMA 50: 4140
EMA 100: 4125
EMA 200: 4105
EMA 400: 4090
These EMA levels can help traders determine potential entry and exit points.
RSI Divergence
The Relative Strength Index (RSI) is a momentum oscillator that measures the speed and change of price movements. Currently, the RSI indicates a divergence suggesting potential reversal signals.
Current RSI Level: 55 (indicating neutral conditions)
Divergence Observed: Bullish divergence on the 4-hour chart, suggesting potential upward movement.
Order Blocks
Identifying order blocks helps traders understand where institutional buying and selling occurred. The order blocks identified on the daily and 4-hour charts are:
Daily Order Block: 4100-4120
4-Hour Order Block: 4130-4150
MACD Analysis
The Moving Average Convergence Divergence (MACD) provides insight into the strength of the trend:
MACD Line: Above the signal line, indicating bullish momentum.
Histogram: Positive values, reinforcing the bullish trend.
Fundamental Analysis & USD News
Upcoming important USD news events can significantly impact the Gold market. Traders should keep an eye on:
Federal Reserve Meetings
Inflation Reports
Employment Data Releases
These events can lead to increased volatility in the Gold market.

💡 Gold XAUUSD Daily Analysis Summary by Kohinoor Free VIP Signals
For real-time updates and analysis, connect with us on WhatsApp here and join our FREE Telegram Channel: @Kohinoorfreevipgoldforexsignals.
Key Levels Summary
Daily Support and Resistance:
Support: 4100, 4080, 4050
Resistance: 4170, 4200, 4225
4-Hour Support and Resistance:
Support: 4120, 4105, 4090
Resistance: 4155, 4165, 4180
EMA Levels:
Daily: 4125, 4100, 4080, 4050
4-Hour: 4140, 4125, 4105, 4090
Weekly Pivots:
1st Level: 4150
2nd Level: 4135
3rd Level: 4120
Daily Pivots:
1st Level: 4140
2nd Level: 4130
3rd Level: 4120
Fibonacci Retracement Levels: 4155, 4130, 4100
FAQs
Why is Kohinoor Free VIP Signals the best signal provider? Kohinoor Free VIP Signals offers not only FREE signals but also educational resources, daily market analysis, and ebooks.
Which brokers are trusted for Gold Forex Crypto trading? Based on client feedback, we recommend brokers like:
How can I receive free trading signals? You can receive free signals by visiting Get FREE Signals.
What educational resources does Kohinoor Free VIP Signals provide? We offer free educational articles and ebooks. Check them out here.
What is the best time to trade Gold? The best time to trade Gold is during high volatility periods, typically during major economic news releases.
How to manage risk while trading Gold? Always use strict stop-loss orders and consider taking partial profits to manage risk effectively.
What are the benefits of using trading signals? Trading signals provide insights that can help traders make informed decisions without needing to analyze the market constantly.
How do I contact Kohinoor Free VIP Signals? You can contact us via WhatsApp here or join our Telegram channel @Kohinoorfreevipgoldforexsignals.
Conclusion
In summary, today's analysis of Gold XAUUSD at 4145 USD highlights crucial support and resistance levels, Fibonacci retracement points, and key indicators such as EMA, RSI, and MACD. By understanding these elements, traders can better navigate the market dynamics and identify potential trading opportunities.

Comments