🟡 Gold XAUUSD Daily Market Analysis—26 June 2026 by Kohinoor Free VIP Signals
- Kohinoor Free VIP Trading Signals
- 17 hours ago
- 3 min read
Current Market Overview
As of today, the live price of Gold (XAUUSD) stands at 4011 USD. This analysis will delve into the daily and 4-hour time frames, utilizing various technical indicators to provide a comprehensive view of the market.
Support & Resistance Levels
In today's analysis, we will explore the support and resistance levels on both daily and 4-hour time frames.
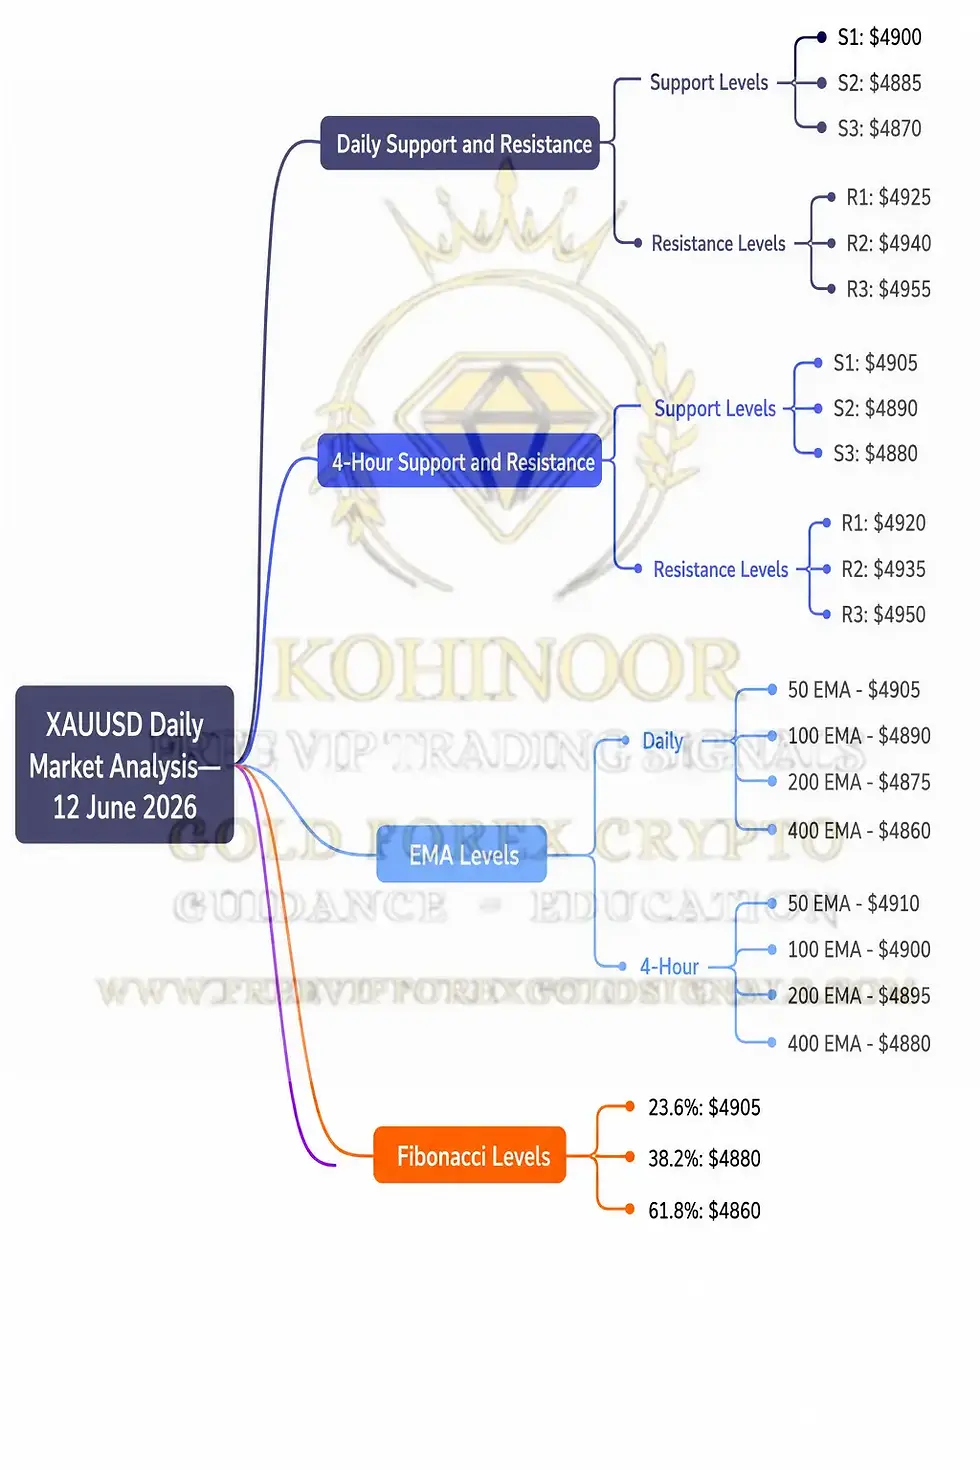
Daily Time Frame Support & Resistance:
Support Levels:
Level 1: 3980 USD
Level 2: 3965 USD
Level 3: 3950 USD
Resistance Levels:
Level 1: 4025 USD
Level 2: 4040 USD
Level 3: 4055 USD
4-Hour Time Frame Support & Resistance:
Support Levels:
Level 1: 4000 USD
Level 2: 3985 USD
Level 3: 3970 USD
Resistance Levels:
Level 1: 4020 USD
Level 2: 4035 USD
Level 3: 4045 USD
Fibonacci Retracement Levels
Fibonacci retracement levels are crucial for identifying potential reversal points. The key daily swing levels are:
Retracement Levels:
23.6%: 4020 USD
38.2%: 3995 USD
61.8%: 3970 USD
Exponential Moving Averages (EMA)
Analyzing the EMA will help us understand the trend direction:
Daily Time Frame EMAs:
EMA 50: 4005 USD
EMA 100: 3990 USD
EMA 200: 3980 USD
EMA 400: 3965 USD
4-Hour Time Frame EMAs:
EMA 50: 4010 USD
EMA 100: 4000 USD
EMA 200: 3985 USD
EMA 400: 3975 USD
RSI Divergence
The Relative Strength Index (RSI) is currently showing signs of divergence, indicating potential price reversals. As we analyze the current RSI levels, we see:
Daily RSI: Currently at 65, indicating overbought conditions.
4-Hour RSI: Currently at 55, suggesting a neutral stance.
Order Blocks
Identifying order blocks can provide insights into potential price movements. Key order blocks are observed at:
Order Block Levels:
Bullish Block: 3985-4000 USD
Bearish Block: 4020-4030 USD
MACD Analysis
The Moving Average Convergence Divergence (MACD) indicator is providing valuable insights into momentum:
MACD Line: Above the Signal Line, indicating bullish momentum.
Histogram: Currently positive, suggesting continuation of the bullish trend.

Summary of Key Levels
💡 Gold XAUUSD Daily Analysis Summary by Kohinoor Free VIP Signals – Contact Us
Key Levels:
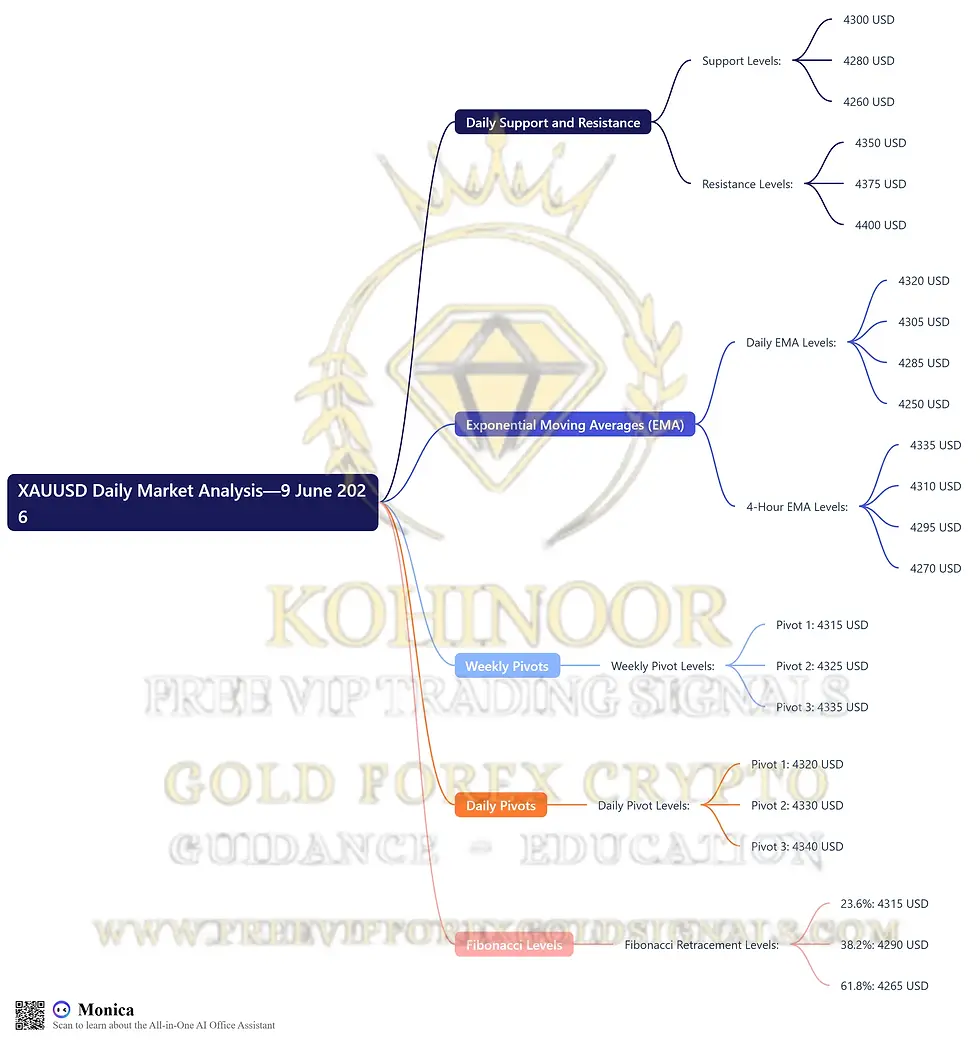
Daily Support and Resistance:
Support: $3980, $3965, $3950
Resistance: $4020, $4035, $4050
Exponential Moving Averages (EMA) Daily:
EMA 50: $4005
EMA 100: $3990
EMA 200: $3975
EMA 400: $3950
Exponential Moving Averages (EMA) 4-Hour:
EMA 50: $4000
EMA 100: $3985
EMA 200: $3970
EMA 400: $3955
Weekly Pivots:
Level 1: $4025
Level 2: $4015
Level 3: $4005
Daily Pivots:
Level 1: $3990
Level 2: $3985
Level 3: $3970
Fibonacci Retracement Levels:
23.6%: $3995
38.2%: $3970
61.8%: $3955
Upcoming USD News
📈 Keep an eye on the upcoming important USD news, including Federal Reserve announcements and economic indicators, as they will significantly impact the Gold market (XAUUSD).
FAQs
Why is Kohinoor Free VIP Signals the best signal provider?
Kohinoor Free VIP Signals offers not only FREE signals but also educational resources, daily market analysis, and ebooks.
Which brokers are trusted for Gold Forex Crypto trading?
Based on client feedback, we recommend brokers like:
What are the benefits of using trading signals?
Trading signals provide you with expert insights, save time on market analysis, and help in making informed trading decisions.
How can I improve my trading skills?
Engage with our educational resources and join our FREE Telegram Channel for daily updates.
What is the best time to trade Gold?
The best time to trade Gold is during the overlap of the London and New York sessions.
How do I manage risk in Gold trading?
Use strict stop-loss orders, take partial profits, and ensure proper risk management strategies.
Conclusion
In summary, the current market analysis for Gold (XAUUSD) on June 26, 2026, highlights a dynamic trading environment characterized by key support and resistance levels, critical Fibonacci retracement points, and various technical indicators such as EMAs, RSI, and MACD. As the price hovers around 4011 USD, traders must remain vigilant to upcoming USD news that could influence market movements.

Comments