Gold XAUUSD Daily Market Analysis—17 April 2026
- Kohinoor Free VIP Trading Signals
- Apr 17
- 3 min read
Current Market Overview
As of today, the live price of Gold (XAUUSD) stands at $4735. With the gold market exhibiting significant volatility, understanding the underlying factors driving these movements is crucial. This analysis will delve into various technical indicators, including Fibonacci Retracement Levels, EMA, RSI divergence, Weekly and Daily Pivots, Smart Money Concepts (SMC), Support & Resistance Levels, Order Blocks, and MACD to provide a comprehensive market outlook.
Technical Analysis
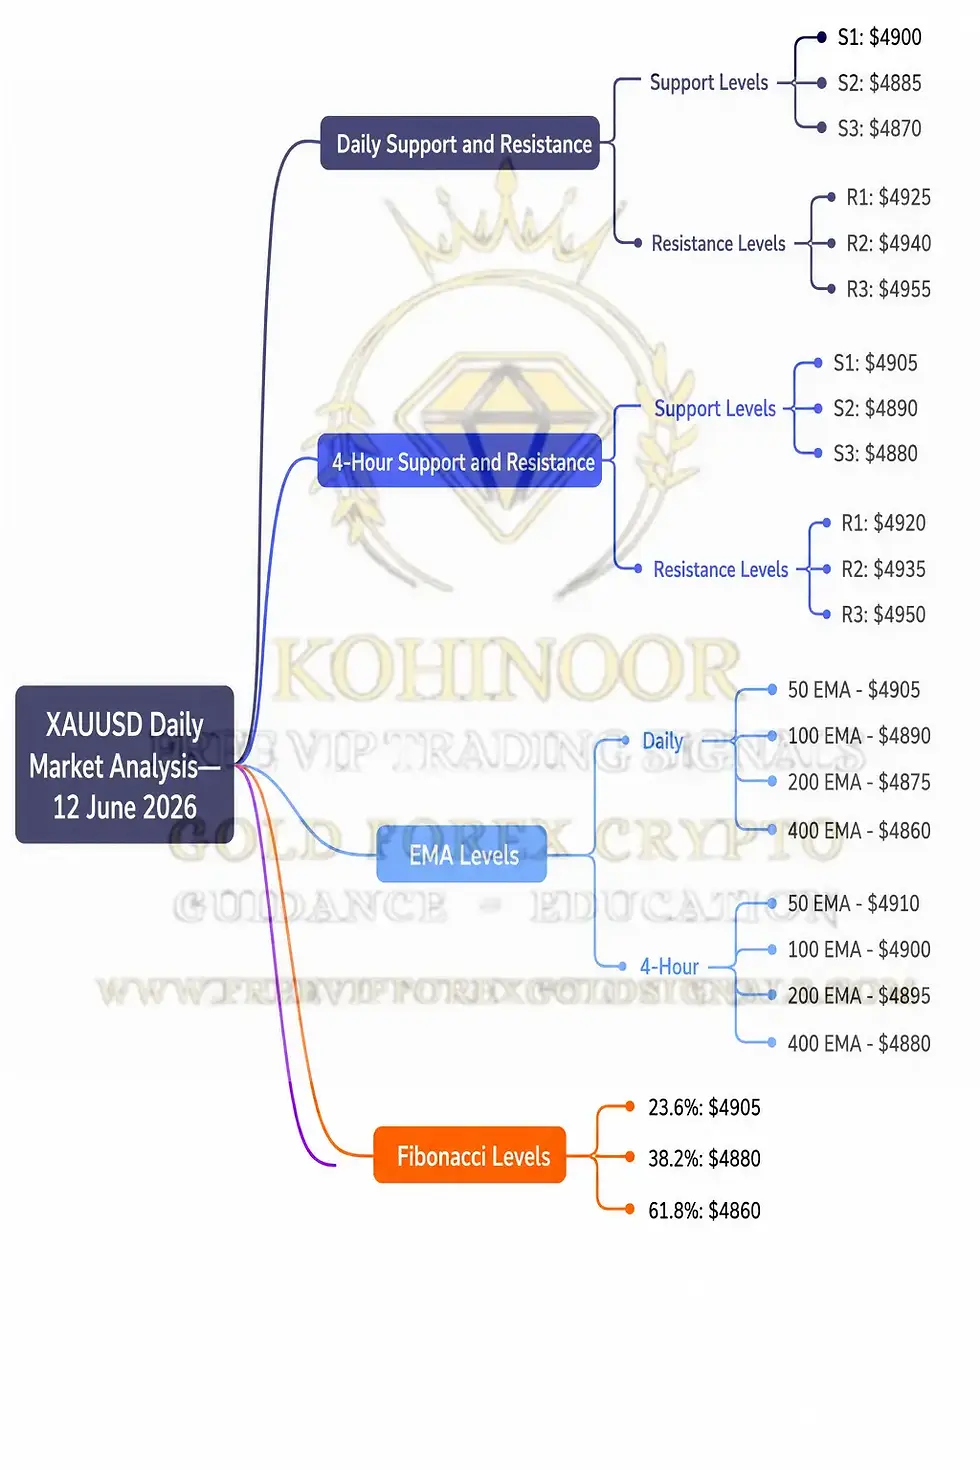
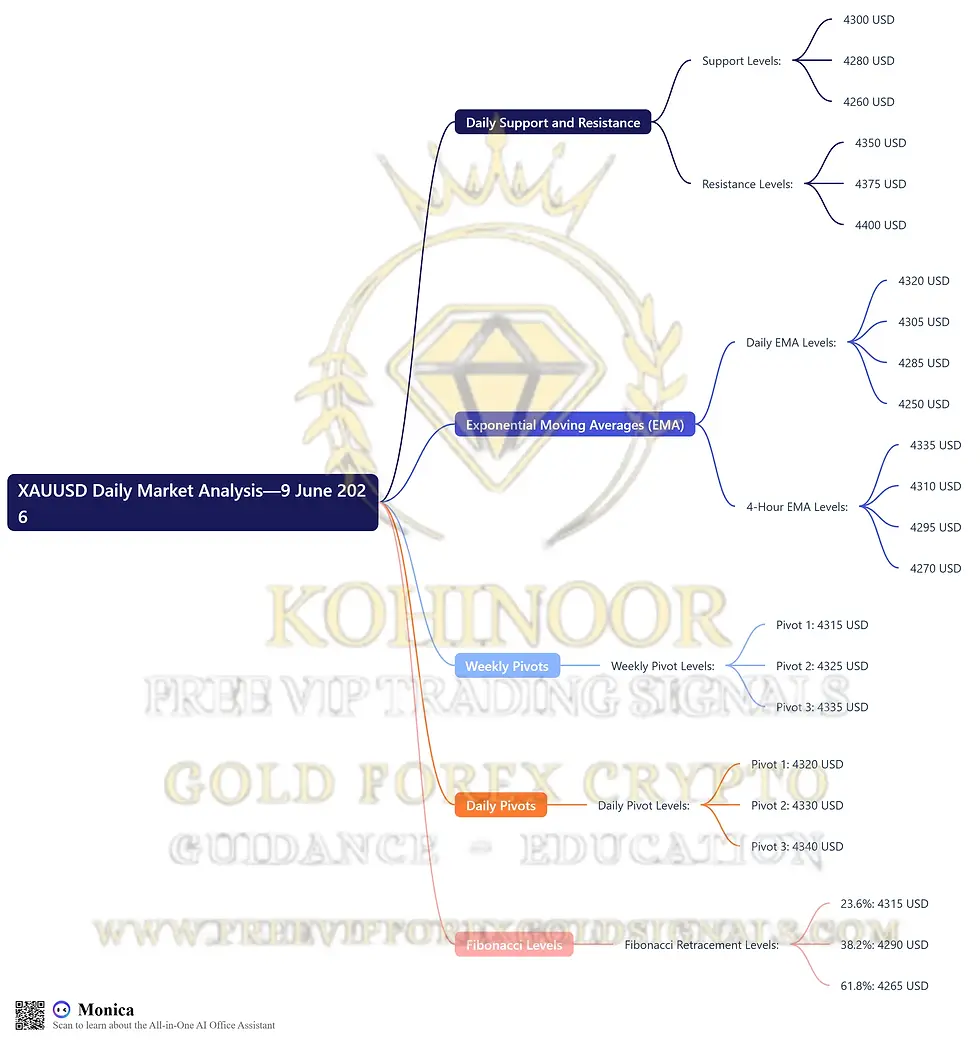
Support & Resistance Levels
In the daily timeframe, the key support and resistance levels are crucial for identifying potential entry and exit points.
Daily Support Levels:
Level 1: $4700
Level 2: $4680
Level 3: $4650
Daily Resistance Levels:
Level 1: $4750
Level 2: $4780
Level 3: $4800
On the 4-hour timeframe, the support and resistance levels are as follows:
4-Hour Support Levels:
Level 1: $4720
Level 2: $4710
Level 3: $4705
4-Hour Resistance Levels:
Level 1: $4740
Level 2: $4755
Level 3: $4765
Fibonacci Retracement Levels
Using the Fibonacci Retracement tool, we identify the following levels based on recent swing highs and lows:
Daily Swing High: $4800
Daily Swing Low: $4650
This gives us the following Fibonacci levels:
38.2% Level: $4740
50% Level: $4725
61.8% Level: $4710
Exponential Moving Averages (EMA)
The Exponential Moving Averages (EMAs) provide insight into the market's trend direction. Based on the current price of $4735, here are the EMA levels:
Daily EMA Levels:
EMA 50: $4725
EMA 100: $4710
EMA 200: $4695
EMA 400: $4675
4-Hour EMA Levels:
EMA 50: $4730
EMA 100: $4720
EMA 200: $4705
EMA 400: $4690
RSI Divergence
The RSI (Relative Strength Index) indicates whether the market is overbought or oversold. Currently, the RSI is at 65, suggesting that gold is approaching overbought territory. A divergence could signal a potential reversal.
Order Blocks
Identifying order blocks helps in understanding where institutional traders are placing their orders. The recent bullish order block is located around $4720, indicating a potential area of support.
MACD Analysis
The MACD (Moving Average Convergence Divergence) shows the momentum of the market. Currently, the MACD line is above the signal line, indicating a bullish trend. However, traders should remain cautious of potential corrections.

Summary of Key Levels
💡 Gold XAUUSD Daily Analysis Summary by Kohinoor Free VIP Signals – Contact Us
Key Levels:
Daily Support and Resistance:
Support: $4700, $4680, $4650
Resistance: $4750, $4780, $4800
EMA Levels on Daily Time Frame:
EMA 50: $4725
EMA 100: $4710
EMA 200: $4695
EMA 400: $4675
EMA Levels on 4-Hour Time Frame:
EMA 50: $4730
EMA 100: $4720
EMA 200: $4705
EMA 400: $4690
Weekly Pivots:
Pivot Level 1: $4750
Pivot Level 2: $4725
Pivot Level 3: $4700
Daily Pivots:
Pivot Level 1: $4740
Pivot Level 2: $4725
Pivot Level 3: $4710
Fibonacci Retracement Levels:
38.2%: $4740
50%: $4725
61.8%: $4710
Fundamental Analysis and USD News
📈 Upcoming important USD news includes the Federal Reserve's interest rate decision and inflation reports. These events can significantly impact the gold market, influencing XAUUSD prices.
FAQs
Why is Kohinoor Free VIP Signals the best signal provider? Kohinoor Free VIP Signals offers not only FREE signals but also educational resources, daily market analysis, and ebooks.
Which brokers are trusted for Gold Forex Crypto trading? Recommended brokers include:
What is the best time to trade Gold? The best time to trade Gold is during the overlap of the London and New York sessions.
How can I learn more about Gold trading? You can access our educational resources at Kohinoor Free VIP Signals.
What are the risks involved in Gold trading? Trading Gold carries risks due to market volatility. Always use risk management strategies.
Can I trade Gold on mobile? Yes, many brokers offer mobile trading platforms for Gold trading.
What is the minimum deposit for trading Gold? Minimum deposits vary by broker; check with your chosen broker for specific details.
Where can I find free trading signals?
Get FREE signals here.
Conclusion
In conclusion, the Gold XAUUSD market presents a dynamic trading environment influenced by various technical and fundamental factors. With the current price at $4735, traders should closely monitor key support and resistance levels, as well as the signals provided by indicators such as Fibonacci retracement, EMA, and MACD.

Comments