BTCUSD Daily Market Analysis—September 25, 2025 by Kohinoor Free VIP Signals
- Kohinoor Free VIP Trading Signals
- Sep 25, 2025
- 4 min read
💬 WhatsApp Kohinoor Free VIP Signals here for FREE BTC Forex Live Trade Setups & Market Analysis.
Current Market Overview
As of today, the live price of Bitcoin (BTCUSD) is 111,825 USD. In this analysis, we will delve into the daily and 4-hour time frames using a variety of technical indicators including Fibonacci Retracement Levels, EMA, RSI divergence, Weekly and Daily Pivots, Smart Money Concepts (SMC), Support & Resistance Levels, Order Blocks, and MACD.
Technical Analysis
Support & Resistance Levels
Daily Time Frame:
Support Levels:
First Support: 110,000 USD
Second Support: 108,500 USD
Third Support: 107,000 USD
Resistance Levels:
First Resistance: 112,500 USD
Second Resistance: 113,800 USD
Third Resistance: 115,000 USD
4-Hour Time Frame:
Support Levels:
First Support: 110,500 USD
Second Support: 109,800 USD
Third Support: 109,200 USD
Resistance Levels:
First Resistance: 112,000 USD
Second Resistance: 113,000 USD
Third Resistance: 114,500 USD
Fibonacci Retracement Levels
Using the recent daily swing high and low, the key Fibonacci levels are identified as follows:
Retracement Level 0%: 115,000 USD (Swing High)
Retracement Level 23.6%: 113,000 USD
Retracement Level 38.2%: 111,500 USD
Retracement Level 61.8%: 109,500 USD
Retracement Level 100%: 107,000 USD (Swing Low)
These levels provide crucial insights into potential reversal points in the market.
Exponential Moving Averages (EMA)
Daily Time Frame:
EMA 50: 111,000 USD
EMA 100: 110,500 USD
EMA 200: 109,800 USD
EMA 400: 108,500 USD
4-Hour Time Frame:
EMA 50: 111,200 USD
EMA 100: 110,800 USD
EMA 200: 110,300 USD
EMA 400: 109,900 USD
The EMAs indicate the trend direction, with price above the EMAs suggesting a bullish trend.
RSI Divergence
Currently, the RSI is at 62, indicating that the market is approaching overbought conditions. A divergence between price and RSI might signal a potential pullback. Monitoring this closely will be essential for traders.
Order Blocks
Identifying order blocks on the daily and 4-hour charts reveals significant buying interest around the 110,000 USD level, suggesting strong support. Conversely, selling pressure is observed near the 112,500 USD level, indicating a potential area of resistance.
MACD Analysis
The MACD histogram shows increasing bullish momentum, with the MACD line crossing above the signal line. This suggests a continuation of the current upward trend, but traders should remain cautious of potential reversals.

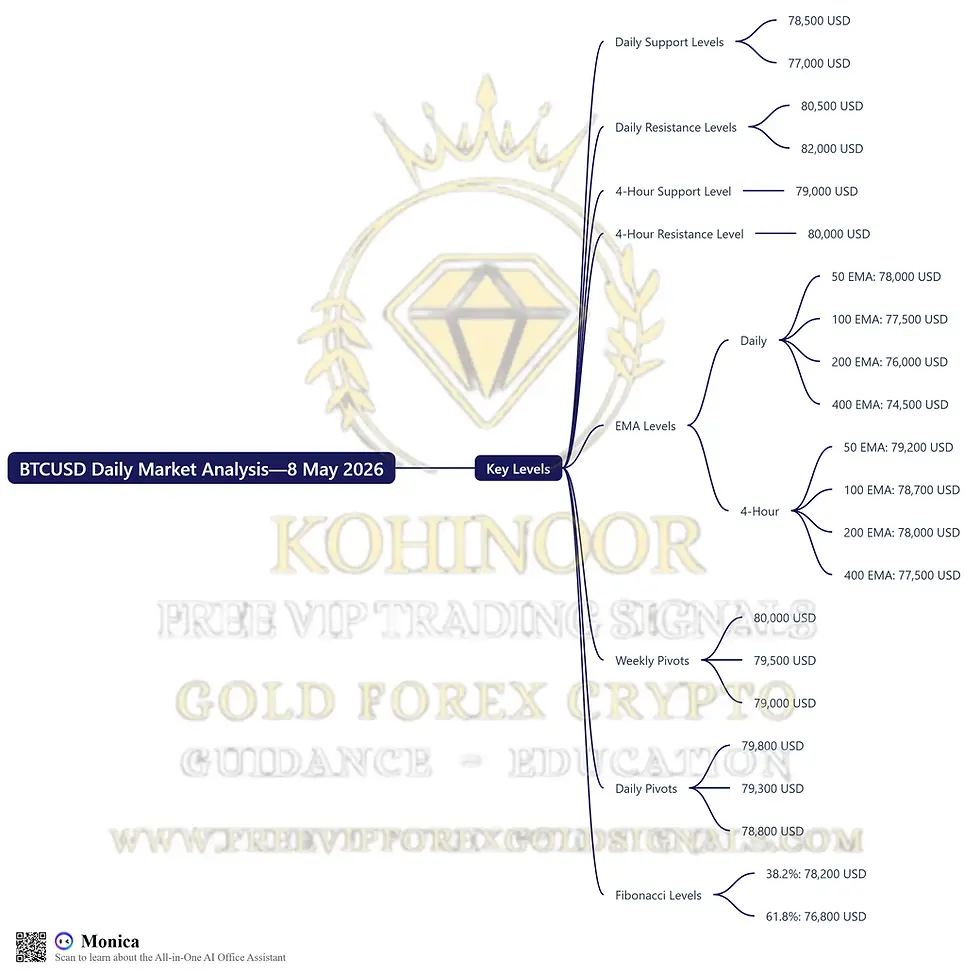
Summary of Key Levels
BTCUSD Daily Analysis Summary by Kohinoor Free VIP Signals – Join Us Here
join our FREE Telegram Channel @Kohinoorfreevipgoldforexsignals
Key Levels:
Daily Support/Resistance:
Support: 110,000 USD, 108,500 USD, 107,000 USD
Resistance: 112,500 USD, 113,800 USD, 115,000 USD
4-Hour Support/Resistance:
Support: 110,500 USD, 109,800 USD, 109,200 USD
Resistance: 112,000 USD, 113,000 USD, 114,500 USD
Exponential Moving Averages:
Daily: EMA 50 (111,000 USD), EMA 100 (110,500 USD), EMA 200 (109,800 USD), EMA 400 (108,500 USD)
4-Hour: EMA 50 (111,200 USD), EMA 100 (110,800 USD), EMA 200 (110,300 USD), EMA 400 (109,900 USD)
Weekly Pivots:
Pivot Point: 111,500 USD
Support: 110,800 USD, 109,500 USD
Resistance: 112,300 USD, 113,000 USD
Daily Pivots:
Pivot Point: 111,200 USD
Support: 110,600 USD, 110,000 USD
Resistance: 112,000 USD, 112,500 USD
Fibonacci Levels:
0%: 115,000 USD, 23.6%: 113,000 USD, 38.2%: 111,500 USD, 61.8%: 109,500 USD, 100%: 107,000 USD
Fundamental Analysis
Upcoming USD News: Stay tuned for significant USD news releases this week, including the Federal Reserve's interest rate decision and employment data, which could impact Bitcoin prices. Market reactions to these events are crucial for traders looking to capitalize on volatility.
FAQs
Why is Kohinoor Free VIP Signals the best signal provider? Kohinoor Free VIP Signals offers not only FREE signals but also educational resources, daily market analysis, and ebooks.
Which brokers are trusted for Gold Forex Crypto trading? Based on client feedback, we recommend:
What are the benefits of using trading signals? Trading signals provide insights into market trends, helping traders make informed decisions.
How can I improve my trading skills? Utilize educational resources and practice with demo accounts to enhance your trading knowledge.
What is the best time to trade Bitcoin? The best time to trade Bitcoin is during major market sessions when liquidity is higher.
How do I manage risk while trading? Implement strict stop-loss orders and take partial profits to manage risk effectively.
Can I trade Bitcoin with a small account? Yes, many brokers offer leverage that allows trading with smaller account sizes.
What tools do I need for successful trading? Use technical analysis tools, economic calendars, and trading platforms to enhance your trading strategy.
Conclusion
In summary, the current analysis of Bitcoin (BTCUSD) highlights significant levels of support and resistance, alongside various technical indicators that traders can utilize for their strategies. For consistent updates and insights, join our FREE Telegram Channel @Kohinoorfreevipgoldforexsignals and stay connected with the market.
Disclaimer
Risk Warning: Trading Forex and CFDs carries a high level of risk to your capital, and you should only trade with money you can afford to lose. Trading Forex and CFDs may not be suitable for all investors, so please ensure that you fully understand the risks involved and seek independent advice if necessary. Please read and ensure you fully understand our Risk Disclosure. Not Financial Advice. Trade at your own risk. Take Partial Profits, Use Strict Stop Loss, and Proper Risk Management.


Comments