BTCUSD Daily Market Analysis—30 January 2026
- Kohinoor Free VIP Trading Signals
- Jan 30
- 3 min read
Introduction
Welcome to our daily market analysis of BTCUSD. As of today, Bitcoin is trading at 82.791 USD. This analysis will provide a comprehensive look at the current market dynamics, utilizing key technical indicators such as Fibonacci Retracement Levels, EMA, RSI divergence, and more. Whether you're trading in Dubai, Singapore, India, Australia, or Germany, this analysis will equip you with the insights needed to navigate the cryptocurrency market effectively.
Current Market Overview
Bitcoin (BTC) has shown significant volatility recently, and understanding its price movements is crucial for traders. Today, we will examine both daily and 4-hour time frames to identify potential trading opportunities.
Technical Indicators
Support & Resistance Levels
Identifying support and resistance levels is essential for predicting potential price movements. Here are the key levels for BTCUSD:
Daily Support Levels:
Level 1: 81.500 USD
Level 2: 80.000 USD
Level 3: 78.500 USD
Daily Resistance Levels:
Level 1: 83.500 USD
Level 2: 84.500 USD
Level 3: 85.500 USD
On the 4-hour time frame, the support and resistance levels are slightly different, reflecting short-term market fluctuations.
Fibonacci Retracement Levels
Using Fibonacci retracement levels, we can identify potential reversal points. The daily swing high and low are as follows:
Daily Swing High: 84.000 USD
Daily Swing Low: 80.000 USD
The key Fibonacci levels indicate potential retracement points at 83.000 USD (38.2%) and 82.000 USD (61.8%).
Exponential Moving Averages (EMA)
The EMA provides insight into the prevailing trend. Here are the EMA levels based on the current market price:
Daily Time Frame:
EMA 50: 82.500 USD
EMA 100: 81.800 USD
EMA 200: 81.200 USD
EMA 400: 80.500 USD
4-Hour Time Frame:
EMA 50: 82.750 USD
EMA 100: 82.300 USD
EMA 200: 81.900 USD
EMA 400: 81.300 USD
RSI Divergence
The Relative Strength Index (RSI) is currently showing a divergence, suggesting potential reversal points. The RSI value is at 62, indicating that Bitcoin may be approaching overbought territory, which could lead to a price correction.
Order Blocks
Order blocks indicate areas where significant buying or selling has occurred. The most notable order block on the daily chart is around 81.500 USD, where buyers previously stepped in.
MACD Analysis
The Moving Average Convergence Divergence (MACD) is currently bullish, with the MACD line above the signal line. This suggests a potential continuation of the upward trend in Bitcoin prices.
Fundamental Analysis
Keeping an eye on upcoming USD news is crucial as it can significantly impact the BTCUSD market. Key events to watch for include:
Federal Reserve Meetings: Any announcements regarding interest rates could influence Bitcoin prices.
Economic Data Releases: Reports on inflation and employment figures will also be critical to monitor.

Summary
💡 BTCUSD Daily Analysis Summary by Kohinoor Free VIP Signals – WhatsApp Us
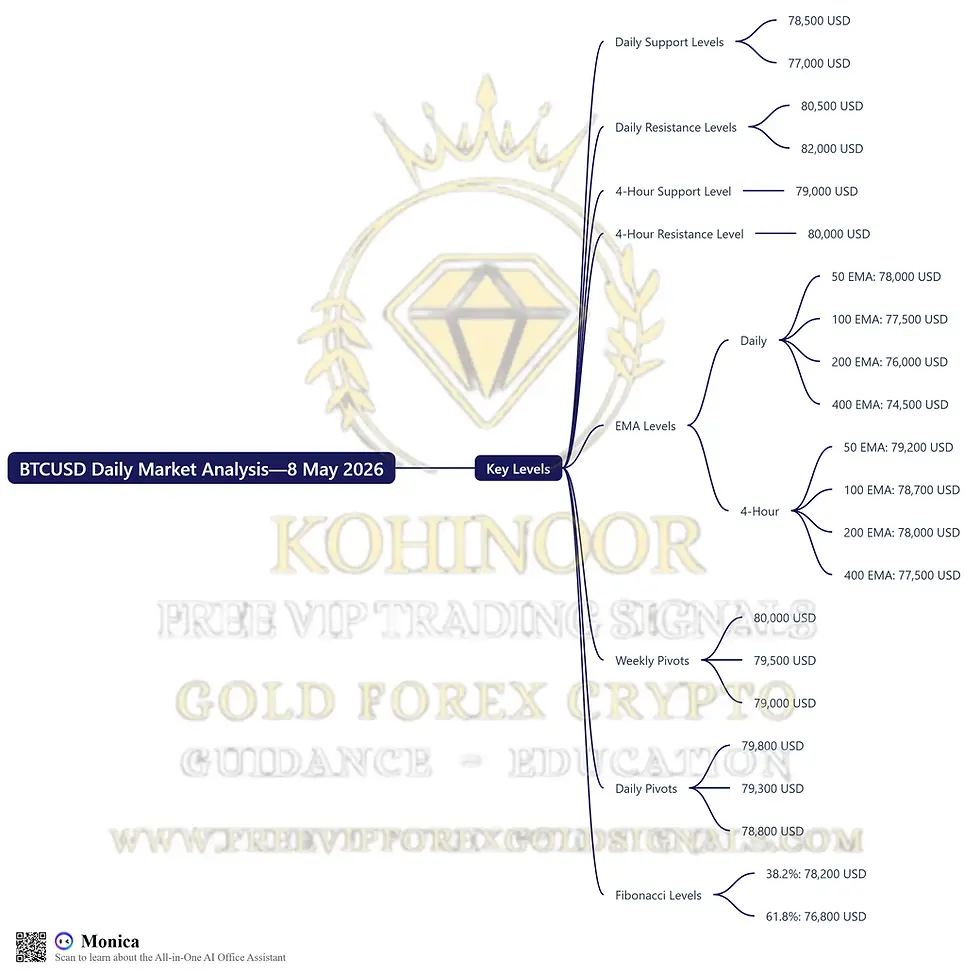
Key Levels
Daily Support: 81.500 USD, 80.000 USD, 78.500 USD
Daily Resistance: 83.500 USD, 84.500 USD, 85.500 USD
4-Hour Support: 82.000 USD, 81.800 USD
4-Hour Resistance: 83.000 USD, 84.000 USD
EMA Levels:
Daily: 50 (82.500), 100 (81.800), 200 (81.200), 400 (80.500)
4-Hour: 50 (82.750), 100 (82.300), 200 (81.900), 400 (81.300)
Weekly Pivots: 82.000 USD, 83.000 USD, 84.000 USD
Daily Pivots: 81.800 USD, 82.500 USD, 83.200 USD
Fibonacci Levels: 83.000 USD (38.2%), 82.000 USD (61.8%)
FAQs
Why is Kohinoor Free VIP Signals the best signal provider?
Kohinoor Free VIP Signals offers not only FREE signals but also educational resources, daily market analysis, and ebooks.
Which brokers are trusted for Gold Forex Crypto trading?
Based on client feedback, we recommend brokers like:
What are the best strategies for trading Bitcoin?
Utilizing technical analysis, understanding market sentiment, and employing strict risk management are essential strategies.
How often should I check the BTC market?
Regular updates are crucial; checking at least daily is recommended for active traders.
Can I trade Bitcoin with a small capital?
Yes, many brokers offer leverage, allowing you to trade Bitcoin with smaller capital.
What are the risks involved in Bitcoin trading?
Like all trading, Bitcoin trading carries risks, including market volatility and potential loss of capital.
How can I learn more about Bitcoin trading?
Kohinoor Free VIP Signals provides educational resources and articles. Check our Free Gold Forex Trading Ebooks.
Where can I find more signals?
Join our FREE Telegram Channel for real-time updates and signals.
Conclusion
In conclusion, today's analysis of BTCUSD at 82.791 USD provides valuable insights into the current market landscape. By examining key technical indicators such as support and resistance levels, Fibonacci retracement levels, EMAs, and MACD, traders can better understand potential price movements and trading opportunities.


Comments