🟡 BTCUSD Daily Market Analysis—July 8, 2025 by Kohinoor Free VIP Signals
- Kohinoor Free VIP Trading Signals
- Jul 8, 2025
- 3 min read
💬 WhatsApp Kohinoor Free VIP Signals here for FREE Gold Forex Live Trade Setups & Market Analysis.
Current Market Overview
As of today, the live price of Bitcoin (BTCUSD) stands at 108,019 USD. Understanding the dynamics of the BTC market is essential for traders aiming to capitalize on price movements. In this analysis, we will explore the daily and 4-hour time frames, employing various technical indicators including Fibonacci Retracement Levels, EMA, RSI divergence, Weekly and Daily Pivots, Smart Money Concepts (SMC), Support & Resistance Levels, Order Blocks, and MACD.
Technical Analysis
Support & Resistance Levels
Identifying key support and resistance levels is crucial for making informed trading decisions. Here are the current levels for both daily and 4-hour time frames:
Daily Support Levels:
S1: 107,500 USD
S2: 107,000 USD
S3: 106,500 USD
Daily Resistance Levels:
R1: 108,500 USD
R2: 109,000 USD
R3: 109,500 USD
4-Hour Support Levels:
S1: 107,800 USD
S2: 107,600 USD
S3: 107,400 USD
4-Hour Resistance Levels:
R1: 108,300 USD
R2: 108,700 USD
R3: 109,000 USD
Fibonacci Retracement Levels
Fibonacci retracement levels help identify potential reversal zones. The key levels based on recent swing highs and lows are:
Key Fibonacci Levels:
23.6%: 108,200 USD
38.2%: 107,900 USD
61.8%: 107,600 USD
Exponential Moving Averages (EMA)
The Exponential Moving Averages provide insights into the trend direction. Here are the EMA levels based on the current market price:
Daily EMA Levels:
EMA 50: 107,850 USD
EMA 100: 107,200 USD
EMA 200: 106,500 USD
EMA 400: 105,800 USD
4-Hour EMA Levels:
EMA 50: 108,000 USD
EMA 100: 107,700 USD
EMA 200: 107,300 USD
EMA 400: 106,900 USD
RSI Divergence
The Relative Strength Index (RSI) helps identify potential overbought or oversold conditions.
Current RSI Value: 72 (indicating overbought conditions)
Order Blocks
Identifying order blocks helps traders understand where institutional buying or selling may occur. Recent order blocks can be observed around the following levels:
Order Block Levels:
108,000 USD (Bullish Order Block)
107,500 USD (Bearish Order Block)
MACD Analysis
The MACD indicator is useful for spotting potential buy and sell signals.
MACD Status: Currently bullish with the MACD line above the signal line.
Fundamental Analysis and Upcoming USD News
In the coming weeks, several important USD news events could impact the BTC market. Traders should keep an eye on:
Upcoming Fed Interest Rate Decision: Expected to influence market volatility.
Non-Farm Payroll Data Release: A critical indicator of economic health.

💡 BTCUSD Daily Analysis Summary by Kohinoor Free VIP Signals
For more insights, contact Kohinoor Free VIP Signals here.
🥇 Join our FREE Telegram Channel: @Kohinoorfreevipgoldforexsignals.
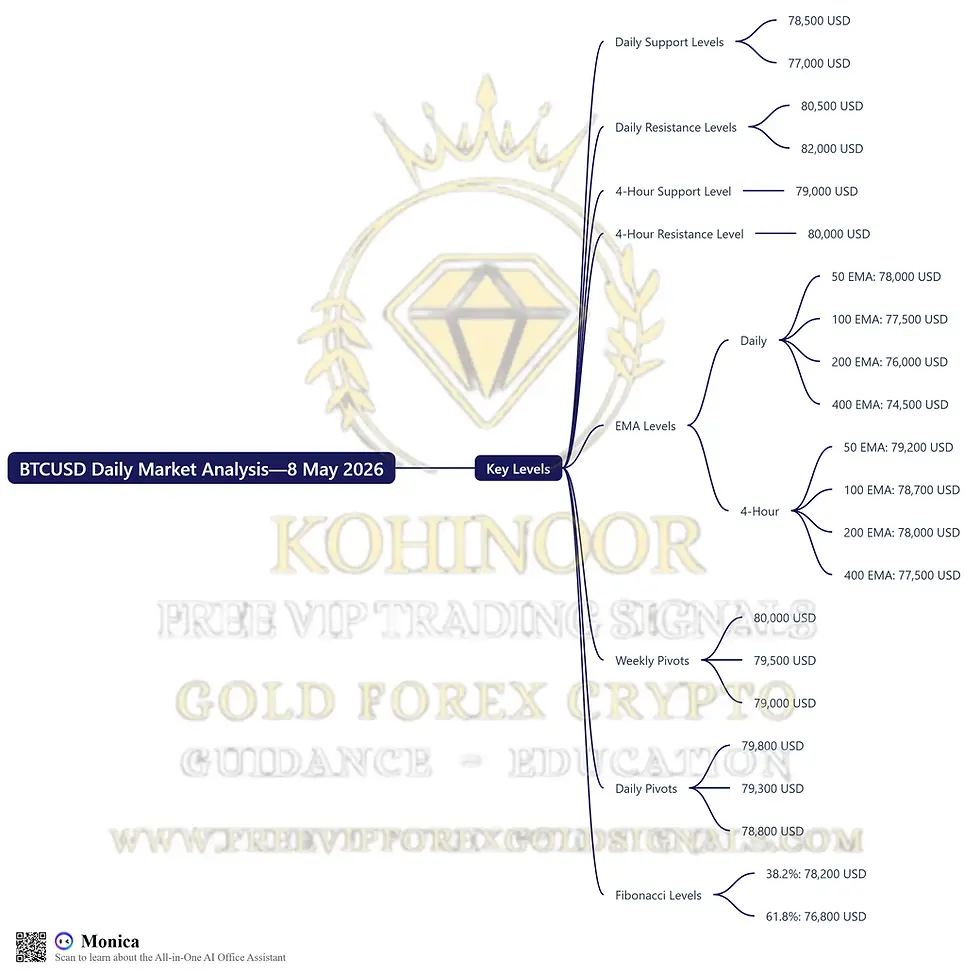
Key Levels Summary
Daily Support and Resistance:
Support: 107,500 USD, 107,000 USD, 106,500 USD
Resistance: 108,500 USD, 109,000 USD, 109,500 USD
Exponential Moving Average (EMA) Levels:
Daily: 50 EMA: 107,850 USD, 100 EMA: 107,200 USD, 200 EMA: 106,500 USD, 400 EMA: 105,800 USD
4-Hour: 50 EMA: 108,000 USD, 100 EMA: 107,700 USD, 200 EMA: 107,300 USD, 400 EMA: 106,900 USD
Weekly Pivots:
P1: 107,800 USD, P2: 108,200 USD, P3: 108,600 USD
Daily Pivots:
P1: 107,700 USD, P2: 108,000 USD, P3: 108,300 USD
Fibonacci Retracement Levels:
23.6%: 108,200 USD, 38.2%: 107,900 USD, 61.8%: 107,600 USD
FAQs
Why is Kohinoor Free VIP Signals the best signal provider?
Kohinoor Free VIP Signals offers not only FREE signals but also educational resources, daily market analysis, and ebooks.
Which brokers are trusted for Gold Forex Crypto trading?
Based on client feedback, we recommend brokers like:
What resources does Kohinoor Free VIP Signals provide?
We provide free educational resources, including Free Gold Forex Trading Ebooks and Free Kohinoor Free VIP Signals Education Articles & Blog.
How can I join Kohinoor Free VIP Signals?
You can join our community by visiting our website.
What is the best time to trade BTC?
The best time to trade BTC is during the overlap of the London and New York sessions.
How do I manage risk while trading BTC?
Always use strict stop-loss orders and take partial profits to manage your risk effectively.
Can I get free trading signals?
Yes, you can get FREE signals by joining our Telegram Channel.
What is the importance of technical analysis in BTC trading?
Technical analysis helps traders make informed decisions based on price patterns and market indicators.
Disclaimer
Risk Warning: Trading Forex and CFDs carries a high level of risk to your capital and you should only trade with money you can afford to lose. Trading Forex and CFDs may not be suitable for all investors, so please ensure that you fully understand the risks involved and seek independent advice if necessary. Please read and ensure you fully understand our Risk Disclosure. Not Financial Advice. Trade at your own risk. Take Partial Profits, Use Strict Stop Loss, and Proper Risk Management.


Comments