BTCUSD Daily Market Analysis—9 December 2025
- Kohinoor Free VIP Trading Signals
- Dec 9, 2025
- 3 min read
Current Market Overview
As of today, the live price of Bitcoin (BTCUSD) stands at 89,890 USD. This analysis will provide a detailed overview of the market using various technical indicators, including Fibonacci Retracement Levels, Exponential Moving Averages (EMA), RSI Divergence, and more, to give traders insights into potential price movements.
Technical Analysis
Support and Resistance Levels
Identifying support and resistance levels is crucial for effective trading strategies. Here are the current levels for BTCUSD:
Daily Support Levels:
Level 1: 88,500 USD
Level 2: 87,800 USD
Level 3: 87,000 USD
Daily Resistance Levels:
Level 1: 90,500 USD
Level 2: 91,200 USD
Level 3: 92,000 USD
4-Hour Support Levels:
Level 1: 89,000 USD
Level 2: 88,700 USD
Level 3: 88,300 USD
4-Hour Resistance Levels:
Level 1: 90,000 USD
Level 2: 90,800 USD
Level 3: 91,500 USD
Fibonacci Retracement Levels
Fibonacci retracement levels are essential for identifying potential reversal points in the market. Based on the recent price action, the key levels are:
Daily Swing High: 91,200 USD
Daily Swing Low: 87,500 USD
From this, the Fibonacci levels are:
23.6%: 90,000 USD
38.2%: 89,400 USD
61.8%: 88,800 USD
Exponential Moving Averages (EMA)
The EMA helps traders understand the trend direction. Based on the current price of 89,890 USD, the EMA levels are as follows:
Daily EMA:
EMA 50: 89,200 USD
EMA 100: 88,500 USD
EMA 200: 87,800 USD
EMA 400: 87,000 USD
4-Hour EMA:
EMA 50: 89,600 USD
EMA 100: 89,200 USD
EMA 200: 88,900 USD
EMA 400: 88,500 USD
RSI Divergence
The Relative Strength Index (RSI) currently sits at 62, indicating that Bitcoin is approaching overbought territory. Traders should exercise caution and look for potential price corrections.
Order Blocks
Order blocks are significant areas where institutional buying or selling has occurred. Current order blocks can be identified around 88,500 USD and 90,500 USD, suggesting potential support and resistance zones.
MACD Analysis
The MACD (Moving Average Convergence Divergence) is currently showing a bullish crossover, suggesting that the upward momentum may continue in the near term. Traders should monitor this indicator for confirmation on the 4-hour chart.
Fundamental Analysis
Upcoming important USD news events can significantly impact the BTCUSD market. Key events to watch include:
Federal Reserve Interest Rate Decision: This will likely influence Bitcoin's price, as changes in interest rates affect investor sentiment towards cryptocurrencies.
US Inflation Data Release: High inflation figures could lead to increased interest in Bitcoin as a hedge against inflation.
Staying informed about these events is crucial for making educated trading decisions.

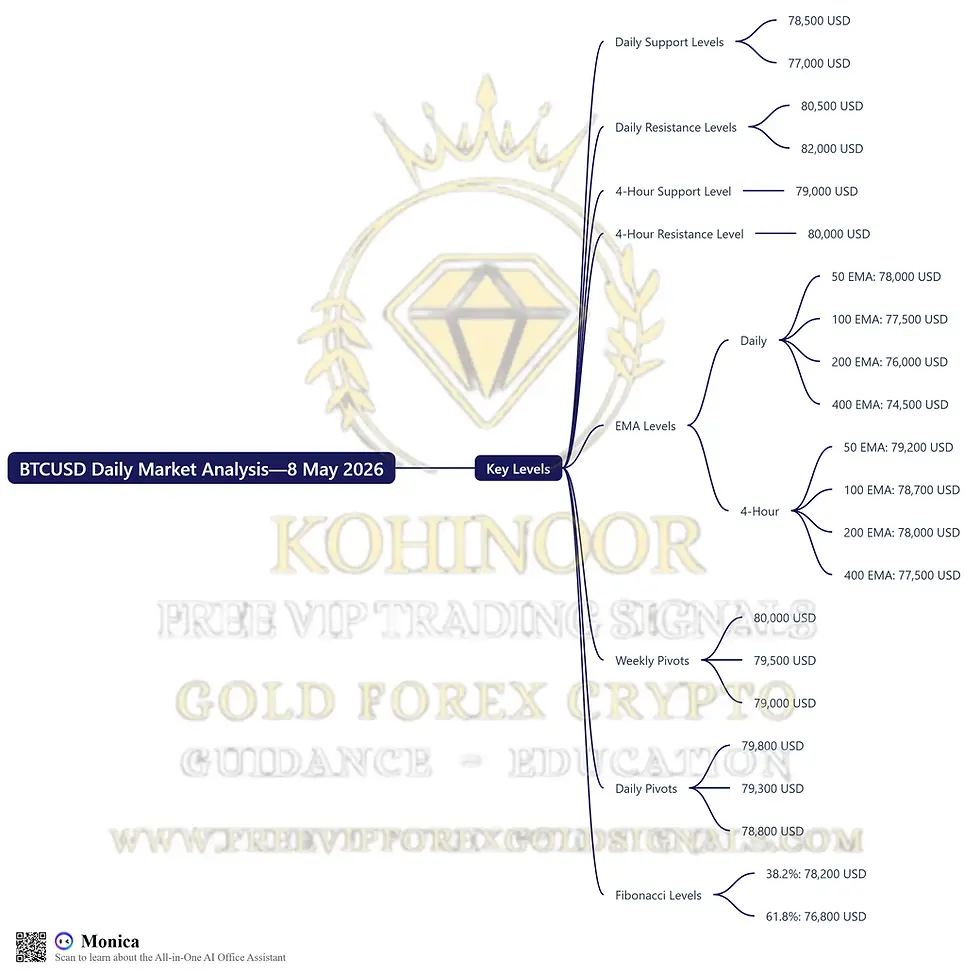
Summary of Key Levels
💡 BTCUSD Daily Analysis Summary by Kohinoor Free VIP Signals – WhatsApp Us
Key Levels:
Daily Support & Resistance:
Support: 88,500 USD, 87,800 USD, 87,000 USD
Resistance: 90,500 USD, 91,200 USD, 92,000 USD
4-Hour Support & Resistance:
Support: 89,000 USD, 88,700 USD, 88,300 USD
Resistance: 90,000 USD, 90,800 USD, 91,500 USD
EMA Levels:
Daily: 89,200 USD (50), 88,500 USD (100), 87,800 USD (200), 87,000 USD (400)
4-Hour: 89,600 USD (50), 89,200 USD (100), 88,900 USD (200), 88,500 USD (400)
Weekly and Daily Pivots:
Weekly Pivots: 90,000 USD, 89,500 USD, 89,000 USD
Daily Pivots: 89,900 USD, 89,700 USD, 89,400 USD
Fibonacci Levels: 90,000 USD, 89,400 USD, 88,800 USD
FAQs
Why is Kohinoor Free VIP Signals the best signal provider?
kohinoor Free VIP Signals offers not only FREE signals but also educational resources, daily market analysis, and ebooks.
Which brokers are trusted for Gold Forex Crypto trading?
Based on client feedback, we recommend brokers like:
What are the benefits of using trading signals?
Trading signals can help you make informed decisions and maximize your trading potential in the forex market.
How can I learn more about forex trading?
You can access our Free Gold Forex Trading Ebooks and Free Kohinoor Free VIP Signals Education Articles & Blog for detailed insights.
What is the best time to trade Bitcoin?
Trading Bitcoin during high volatility periods, typically during major economic news releases, can yield better opportunities.
How do I manage risk while trading Bitcoin?
Implementing strict stop-loss orders and taking partial profits can help manage risk effectively.
Can I trade Bitcoin with a small capital?
Yes, many brokers offer leverage, allowing you to trade Bitcoin with a smaller capital base.
How often should I check my trading signals?
Regularly checking your signals, especially during market hours, can help you stay updated on potential trading opportunities.
Conclusion
In conclusion, the current analysis of BTCUSD at a price of 89,890 USD reveals a market characterized by significant support and resistance levels, as well as critical technical indicators that can guide trading strategies. With daily and 4-hour time frames analyzed using tools such as Fibonacci retracement levels, EMAs, RSI divergence, and MACD, traders are equipped with valuable insights into potential price movements.


Comments