BTCUSD Daily Market Analysis—27 March 2026 by Kohinoor Free VIP Signals
- Kohinoor Free VIP Trading Signals
- Mar 27
- 3 min read
Introduction
In today's analysis, we will dive deep into the BTCUSD market, currently trading at $68,727. This comprehensive overview will utilize various technical indicators, including Fibonacci Retracement Levels, EMA, RSI divergence, and more, to provide insights for traders across Dubai, Singapore, India, Australia, Germany, and the Netherlands.
Join our FREE Telegram Channel: @Kohinoorfreevipgoldforexsignals
Market Analysis Overview
Current Market Price
BTCUSD Price: $68,727
Support & Resistance Levels
Understanding support and resistance levels is crucial for traders. Here’s a breakdown based on daily and 4-hour timeframes:
Daily Support Levels:
Level 1: $67,500
Level 2: $66,800
Level 3: $66,200
Daily Resistance Levels:
Level 1: $69,200
Level 2: $70,000
Level 3: $71,500
4-Hour Support Levels:
Level 1: $68,000
Level 2: $67,500
Level 3: $67,000
4-Hour Resistance Levels:
Level 1: $69,000
Level 2: $69,500
Level 3: $70,000
Fibonacci Retracement Levels
Using Fibonacci Retracement Levels helps identify potential reversal areas. Key levels to watch are:
Retracement Levels:
23.6%: $69,000
38.2%: $68,500
61.8%: $67,800
Exponential Moving Averages (EMA)
Analyzing EMAs provides insights into market trends:
Daily Time Frame:
EMA 50: $68,300
EMA 100: $67,800
EMA 200: $67,200
EMA 400: $66,800
4-Hour Time Frame:
EMA 50: $68,600
EMA 100: $68,200
EMA 200: $67,800
EMA 400: $67,300
RSI Divergence
The Relative Strength Index (RSI) indicates whether BTCUSD is overbought or oversold:
Current RSI Level: 65 (indicating overbought conditions)
Divergence Analysis: Watch for potential price corrections if RSI begins to decline while prices rise.
Order Blocks
Order blocks are crucial for understanding institutional trading:
Key Order Blocks:
Bullish Order Block: $67,800 - $68,000
Bearish Order Block: $69,500 - $70,000
MACD Analysis
The Moving Average Convergence Divergence (MACD) helps confirm trends:
Current MACD Level: Positive, indicating bullish momentum.
Signal Line: Watch for potential crossovers that could signal trend changes.
Summary
💡 BTCUSD Daily Analysis Summary by Kohinoor Free VIP Signals – WhatsApp us for real-time updates.
Key Levels
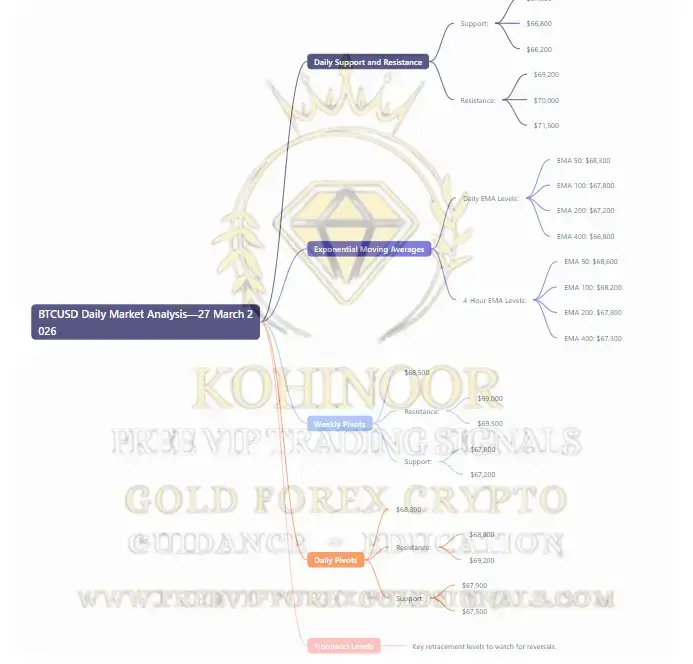
Daily Support and Resistance:
Support: $67,500, $66,800, $66,200
Resistance: $69,200, $70,000, $71,500
Exponential Moving Averages:
Daily EMA Levels: 50 - $68,300, 100 - $67,800, 200 - $67,200, 400 - $66,800
4-Hour EMA Levels: 50 - $68,600, 100 - $68,200, 200 - $67,800, 400 - $67,300
Weekly Pivots:
Pivot Point: $68,500
Resistance: $69,000, $69,500
Support: $67,800, $67,200
Daily Pivots:
Pivot Point: $68,300
Resistance: $68,800, $69,200
Support: $67,900, $67,500
Fibonacci Levels: Key retracement levels to watch for reversals.
Upcoming USD News
📈 Keep an eye on upcoming USD news that could impact the BTCUSD market:
Federal Reserve Meeting: Potential interest rate changes.
Non-Farm Payrolls: Employment data release.
FAQs
Why is Kohinoor Free VIP Signals the best signal provider?
Kohinoor Free VIP Signals offers not only FREE signals but also educational resources, daily market analysis, and ebooks
Which brokers are trusted for Gold Forex Crypto trading?
Based on client feedback, we recommend brokers like:
How can I get FREE trading signals?
You can get FREE signals by visiting our website: Get FREE Signals.
What educational resources do you offer?
We provide a variety of educational resources, including articles and videos. Check out our Kohinoor Free VIP Signals Education Articles & Blog.
How can I join your Telegram channel?
Join our FREE Telegram Channel: @Kohinoorfreevipgoldforexsignals.
What is the best time to trade BTCUSD?
The best time to trade BTCUSD is during high volatility periods, typically around major market openings and news releases.
How do I manage risk in trading?
Implement strict stop-loss orders and take partial profits to manage risk effectively.
Why should I follow your signals?
Our signals are backed by thorough analysis and provide insights tailored for traders in various regions, including Dubai, Singapore, India, Australia, Germany, and the Netherlands.
Conclusion
In conclusion, the current analysis of the BTCUSD market at $68,727 reveals critical insights for traders across various regions, including Dubai, Singapore, India, Australia, Germany, and the Netherlands. By leveraging technical indicators such as Fibonacci Retracement Levels, EMA, RSI divergence, and MACD, traders can make informed decisions in this volatile market.

Comments