BTCUSD Daily Market Analysis—12 June 2026 by Kohinoor Free VIP Signals
- Kohinoor Free VIP Trading Signals
- 1 day ago
- 3 min read
Current Market Overview
As of today, the BTCUSD market is trading at $63,608. This analysis will delve into the daily and 4-hour time frames, utilizing various technical indicators such as Fibonacci Retracement Levels, EMA, RSI divergence, and more to provide a comprehensive overview of the market.
Support & Resistance Levels
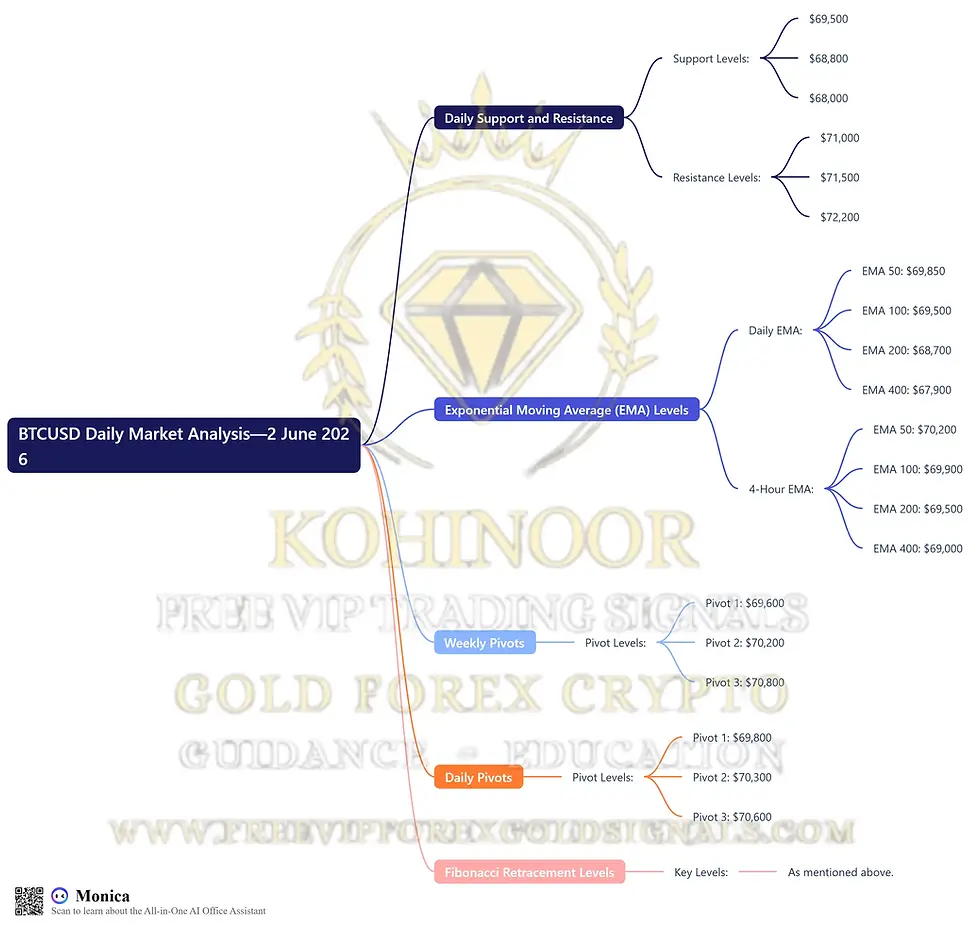
Daily Time Frame Support & Resistance
Support Level 1: $62,500
Support Level 2: $61,000
Resistance Level 1: $64,500
Resistance Level 2: $65,200
4-Hour Time Frame Support & Resistance
Support Level 1: $63,000
Resistance Level 1: $63,800
Fibonacci Retracement Levels
Fibonacci levels play a crucial role in identifying potential reversal zones. The key levels for the current market are:
0% Level: $63,608 (Current Price)
23.6% Level: $64,000
38.2% Level: $64,500
61.8% Level: $62,500
Exponential Moving Averages (EMA)
Daily Time Frame EMAs
EMA 50: $62,800
EMA 100: $62,300
EMA 200: $61,500
EMA 400: $60,000
4-Hour Time Frame EMAs
EMA 50: $63,200
EMA 100: $63,000
EMA 200: $62,800
EMA 400: $62,500
RSI Divergence
The RSI is currently at 55, indicating a neutral market sentiment. However, divergence signals could suggest potential trend reversals, which traders should monitor closely.
MACD Analysis
The MACD line is above the signal line, suggesting bullish momentum in the BTCUSD market. Traders should watch for any crossover signals that may indicate a change in market direction.
Order Blocks
Identifying order blocks on the daily and 4-hour charts can provide insights into potential price action. Current order blocks are located at:
Daily Order Block: $62,500 - $63,000
4-Hour Order Block: $63,000 - $63,800

Summary: BTCUSD Daily Analysis Summary by Kohinoor Free VIP Signals
For a detailed market analysis and daily trading signals, join our FREE Telegram Channel: @Kohinoorfreevipgoldforexsignals.
Key Levels Summary
Daily Support: $62,500, $61,000
Daily Resistance: $64,500, $65,200
4-Hour Support: $63,000
4-Hour Resistance: $63,800
EMA Levels:
Daily: 50 - $62,800, 100 - $62,300, 200 - $61,500, 400 - $60,000
4-Hour: 50 - $63,200, 100 - $63,000, 200 - $62,800, 400 - $62,500
Weekly Pivots: $62,800, $63,200, $64,000
Daily Pivots: $62,700, $63,000, $63,500
Fibonacci Levels: 0% - $63,608, 23.6% - $64,000, 38.2% - $64,500, 61.8% - $62,500
Fundamental Analysis and USD News
Upcoming USD news events this month could significantly impact the BTCUSD market. Traders should be aware of Federal Reserve announcements and economic indicators that may affect market volatility.
FAQs
Why is Kohinoor Free VIP Signals the best signal provider? Kohinoor Free VIP Signals offers not only FREE signals but also educational resources, daily market analysis, and ebooks.
Which brokers are trusted for Gold Forex Crypto trading? Based on client feedback, we recommend brokers like:
How can I access free trading signals? You can access free signals by visiting Get FREE Signals.
What educational resources does Kohinoor Free VIP Signals offer? We provide Free Gold Forex Trading Ebooks and Free Education Articles & Blog.
How often are the trading signals updated? Our trading signals are updated daily to reflect the latest market conditions.
Can I trust the analysis provided by Kohinoor Free VIP Signals? Yes, our analysis is based on comprehensive market research and technical indicators.
What is the best time frame for trading BTCUSD? The best time frame depends on your trading strategy, but both daily and 4-hour time frames are commonly used.
How do I manage risk while trading? Always use strict stop-loss orders and consider taking partial profits to manage risk effectively.
Conclusion
In conclusion, the BTCUSD market remains dynamic, with current trading at $63,608 reflecting both bullish and bearish sentiments. Utilizing key indicators such as Fibonacci Retracement Levels, EMAs, RSI divergence, and MACD analysis, traders can gain valuable insights into potential price movements.


Comments