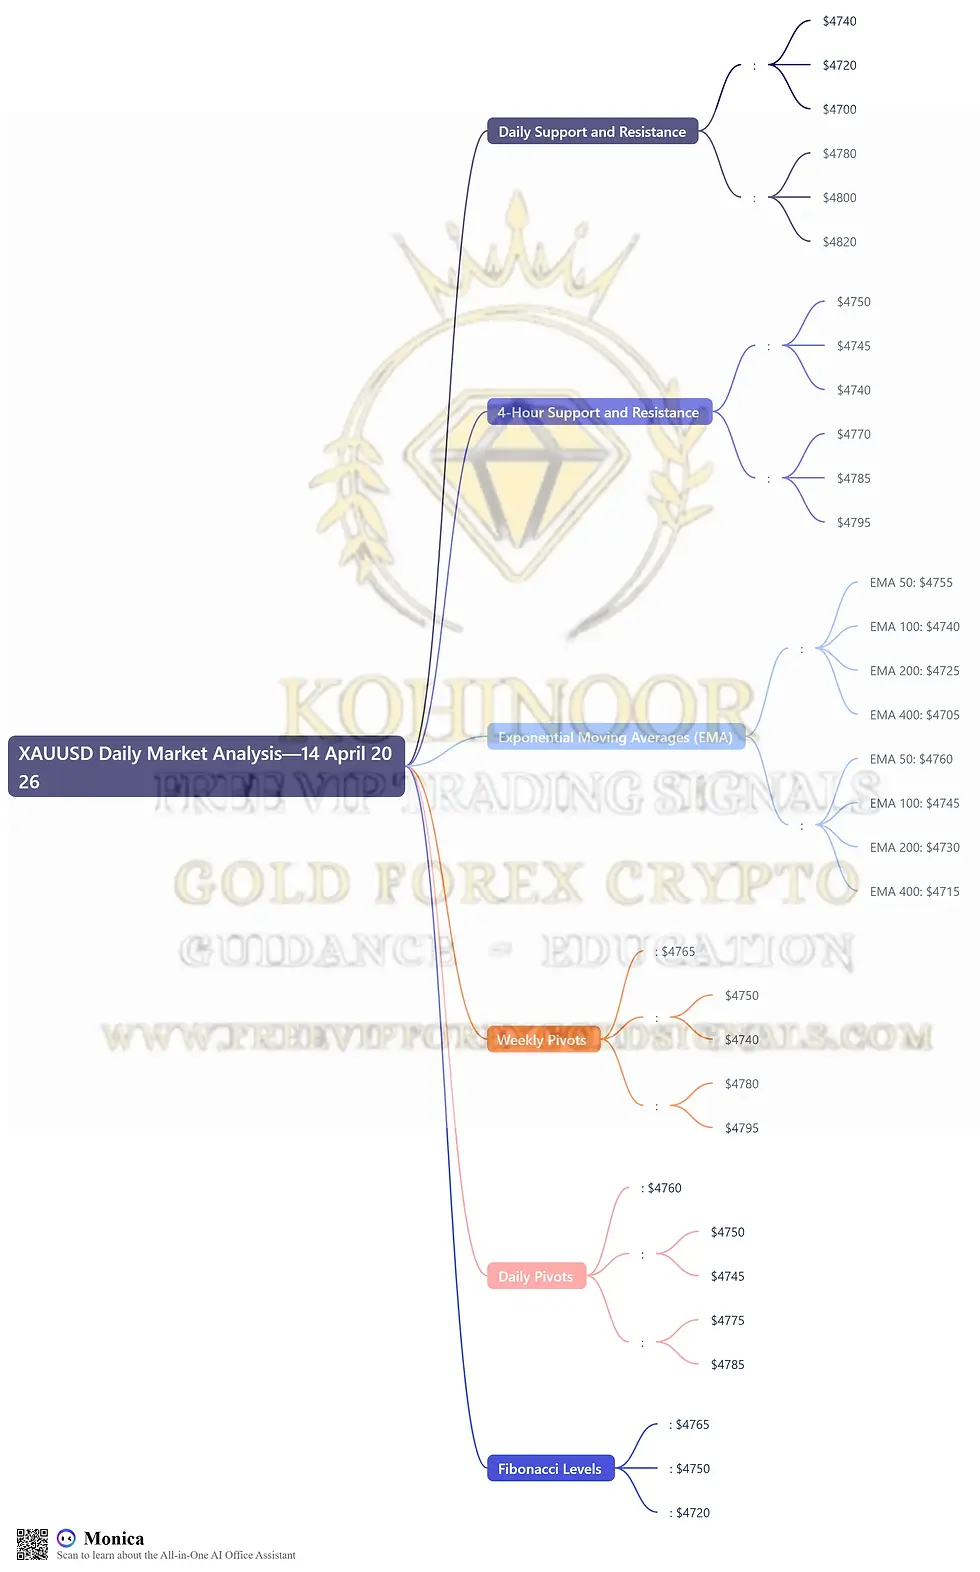
Gold XAUUSD Daily Market Analysis—14 April 2026
- Kohinoor Free VIP Trading Signals
- Apr 14
- 3 min read
Introduction
Gold (XAUUSD) remains a focal point for traders, especially in dynamic markets like Dubai, Singapore, India, Australia, Germany, and the Netherlands. As of today, the live market price stands at $4769. This analysis will delve into daily and 4-hour time frames, utilizing various technical indicators to provide insights for traders.
Current Market Overview
Price Action and Trend Analysis
The price of gold has shown significant movement recently, influenced by various economic factors. As we analyze the current price of $4769, it's crucial to examine the trends and potential reversal points.
Technical Indicators
Support and Resistance Levels
Daily Support Levels:
Level 1: $4740
Level 2: $4720
Level 3: $4700
Daily Resistance Levels:
Level 1: $4780
Level 2: $4800
Level 3: $4820
4-Hour Support Levels:
Level 1: $4750
Level 2: $4745
Level 3: $4740
4-Hour Resistance Levels:
Level 1: $4770
Level 2: $4785
Level 3: $4795
Fibonacci Retracement Levels
Using Fibonacci retracement, we can identify key swing levels:
Daily Swing High: $4820
Daily Swing Low: $4700
Key Fibonacci Levels:
23.6%: $4765
38.2%: $4750
61.8%: $4720
Exponential Moving Averages (EMA)
Daily Time Frame:
EMA 50: $4755
EMA 100: $4740
EMA 200: $4725
EMA 400: $4705
4-Hour Time Frame:
EMA 50: $4760
EMA 100: $4745
EMA 200: $4730
EMA 400: $4715
RSI Divergence
The Relative Strength Index (RSI) on both time frames shows potential divergence, indicating possible price reversals. Currently, the RSI is at 65, suggesting that gold may be overbought, warranting caution.
Order Blocks
Identifying order blocks on the daily chart reveals significant buying interest around $4750, while selling pressure is noted near $4780.
MACD Analysis
The MACD indicator shows a bullish crossover, indicating upward momentum. However, traders should watch for potential corrections as the price approaches resistance levels.
Fundamental Analysis
Upcoming USD News Impacting Gold
Monitoring upcoming economic reports is crucial for predicting gold price movements. Key events include:
US Inflation Data: Scheduled for later this month, inflation rates can significantly influence gold prices.
Federal Reserve Meetings: Any announcements regarding interest rates can lead to volatility in the gold market.
Summary
💡 Gold XAUUSD Daily Analysis Summary by Kohinoor Free VIP Signals – Contact Us
🥇 Join our FREE Telegram Channel: @Kohinoorfreevipgoldforexsignals
Key Levels Summary
Daily Support and Resistance:
Support: $4740, $4720, $4700
Resistance: $4780, $4800, $4820
4-Hour Support and Resistance:
Support: $4750, $4745, $4740
Resistance: $4770, $4785, $4795
Exponential Moving Averages (EMA):
Daily: 50 - $4755, 100 - $4740, 200 - $4725, 400 - $4705
4-Hour: 50 - $4760, 100 - $4745, 200 - $4730, 400 - $4715
Weekly Pivots:
Pivot: $4765
Support: $4750, $4740
Resistance: $4780, $4795
Daily Pivots:
Pivot: $4760
Support: $4750, $4745
Resistance: $4775, $4785
Fibonacci Levels:
23.6%: $4765, 38.2%: $4750, 61.8%: $4720
FAQs
Why is Kohinoor Free VIP Signals the best signal provider?
Kohinoor Free VIP Signals offers not only FREE signals but also educational resources, daily market analysis, and ebooks
Which brokers are trusted for Gold Forex Crypto trading?
Based on client feedback, we recommend brokers like:
What are the benefits of using trading signals?
Trading signals provide insights into market trends, helping traders make informed decisions and increase their chances of success.
How can I improve my trading skills?
Consider joining educational programs and utilizing resources provided by platforms like Kohinoor Free VIP Signals.
What is the best time to trade gold?
The best time to trade gold often coincides with major market openings and economic news releases.
Can I trade gold on weekends?
Most forex brokers do not allow trading on weekends, but some may offer limited options for gold trading.
How does geopolitical tension affect gold prices?
Geopolitical tensions often lead to increased demand for gold as a safe-haven asset, driving prices higher.
What is the importance of risk management in trading?
Risk management is crucial to protect your capital and minimize losses, ensuring long-term success in trading.
Conclusion
In conclusion, today's analysis of Gold (XAUUSD) at $4769 highlights the importance of utilizing various technical indicators such as support and resistance levels, Fibonacci retracement, EMA, RSI divergence, and MACD to inform trading decisions. As we navigate the complexities of the gold market, traders in regions like Dubai, Singapore, India, Australia, Germany, and the Netherlands can leverage this information for better outcomes.

Comments