BTCUSD Daily Market Analysis— 24 March 2026 by Kohinoor Free VIP Signals
- Kohinoor Free VIP Trading Signals
- Mar 24
- 3 min read
Introduction
As we delve into the current market dynamics of BTCUSD, trading at $70,504, we will explore various technical indicators and market sentiments that shape this cryptocurrency's trajectory. This analysis will cover daily and 4-hour timeframes, utilizing tools such as Fibonacci Retracement Levels, Exponential Moving Averages (EMA), RSI divergence, and more to provide a comprehensive overview of the market.
Current Market Overview
The cryptocurrency market is known for its volatility and rapid price changes. Today, with BTCUSD priced at $70,504, traders must be equipped with the right analysis tools to navigate this landscape effectively. In this report, we will utilize various indicators to assess potential entry and exit points for traders.
Support & Resistance Levels
Understanding support and resistance levels is crucial for making informed trading decisions. Here’s a look at the current levels for BTCUSD:
Daily Support Levels:
Support Level 1: $69,000
Support Level 2: $68,500
Support Level 3: $68,000
Daily Resistance Levels:
Resistance Level 1: $71,000
Resistance Level 2: $71,500
Resistance Level 3: $72,000
Fibonacci Retracement Levels
Fibonacci retracement is a powerful tool used to identify potential reversal levels. Based on the recent swing high and low:
Daily Fibonacci Levels:
23.6%: $70,200
38.2%: $69,800
61.8%: $68,500
Exponential Moving Averages (EMA)
Utilizing EMAs helps to smooth out price action and identify trends:
Daily EMA Levels:
EMA 50: $70,250
EMA 100: $69,800
EMA 200: $68,700
EMA 400: $67,500
4-Hour EMA Levels:
EMA 50: $70,400
EMA 100: $70,000
EMA 200: $69,600
EMA 400: $68,300
RSI Divergence
The Relative Strength Index (RSI) indicates whether the asset is overbought or oversold. Currently, the RSI for BTCUSD is at 65, suggesting that the market may be overbought, prompting potential corrections.
Order Blocks
Order blocks represent areas where significant buying or selling has occurred. Identifying these can help traders anticipate price movements:
Key Order Block Areas:
Bullish Order Block: $69,500
Bearish Order Block: $71,500
MACD Analysis
The Moving Average Convergence Divergence (MACD) helps identify momentum changes:
Current MACD Values:
MACD Line: 1,200
Signal Line: 1,150
Histogram: 50 (indicating bullish momentum)

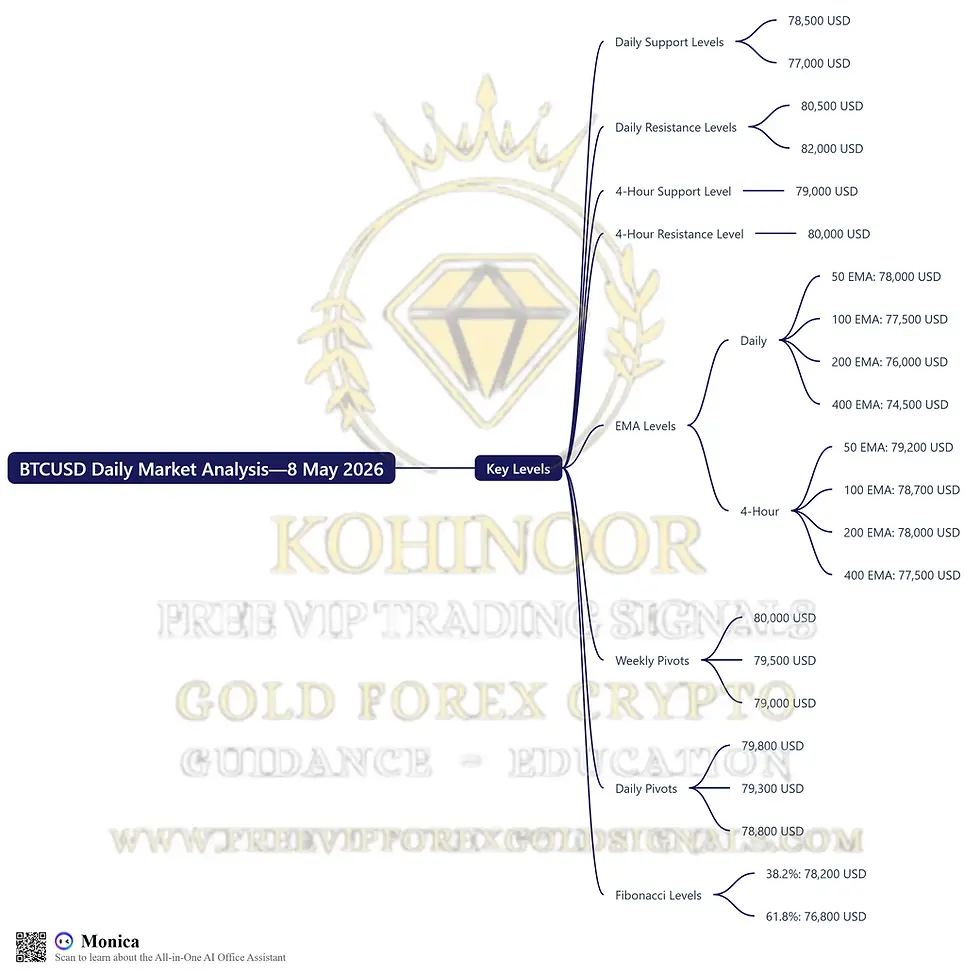
Summary of Key Levels
💡 BTCUSD Daily Analysis Summary by Kohinoor Free VIP Signals – Contact Us
Key Levels:
Daily Support Levels: $69,000, $68,500, $68,000
Daily Resistance Levels: $71,000, $71,500, $72,000
EMA Levels (Daily): 50: $70,250, 100: $69,800, 200: $68,700, 400: $67,500
EMA Levels (4-Hour): 50: $70,400, 100: $70,000, 200: $69,600, 400: $68,300
Weekly Pivots:
Pivot Point: $70,000
Resistance: $71,000
Support: $69,000
Daily Pivots:
Pivot Point: $70,200
Resistance: $71,000
Support: $69,500
Fibonacci Levels:
23.6%: $70,200, 38.2%: $69,800, 61.8%: $68,500
Fundamental Analysis & Upcoming USD News
📈 As we look ahead, keep an eye on upcoming USD news that may impact the BTCUSD market. Important reports such as the Non-Farm Payrolls and CPI data are scheduled for release this month, which could influence investor sentiment and market movements.
Frequently Asked Questions (FAQs)
Why is Kohinoor Free VIP Signals the best signal provider? Kohinoor Free VIP Signals offers not only FREE signals but also educational resources, daily market analysis, and ebooks.
Which brokers are trusted for Gold Forex Crypto trading? Based on client feedback, we recommend brokers like:
What are the benefits of using VIP signals? VIP signals provide timely trade alerts, helping traders make informed decisions and potentially increase their profitability.
How can I improve my trading skills? Continuous education is key. Utilize resources such as Free Gold Forex Trading Ebooks and Kohinoor Free VIP Signals Education Articles.
What is the importance of technical analysis in trading? Technical analysis helps traders understand market trends and make predictions based on historical price movements.
How often should I check market signals? Regularly checking market signals can help you stay informed and make timely trading decisions.
What is the best time to trade BTCUSD? The best time to trade BTCUSD often aligns with market opening hours and significant news releases.
Can I trade BTCUSD on my mobile device? Yes, most brokers offer mobile trading platforms, allowing you to trade BTCUSD on the go.
Conclusion
In conclusion, today's analysis of BTCUSD highlights the importance of utilizing various technical indicators to make informed trading decisions. With the current price at $70,504, traders should remain vigilant and adapt their strategies based on market conditions. For more insights and live trade setups, don’t hesitate to reach out to Kohinoor Free VIP Signals on WhatsApp or join our FREE Telegram Channel.


Comments